2
$\begingroup$

I want to see what will happen for different values of the parameters $k_1$ and $k_2$, but all I see is an empty plot.

Can someone help me?

Manipulate[ 
 Plot[
 {
  x -> Function[{t}, 1 - (-1 + k2*E^(k1*t + k1 )) /(-1 + k1*E^(k1*t + k1 ) + k2*E^(k1*t + k1 ))]
  , u -> Function[{t}, (-1 + k2*E^(k1*t + k1) ) /(-1 + E^(k1* t + k1 ) *k1 + E^(k1 t C[1] + k1 C[1] C[2]) *k2)]
 }
 , {t, 0, 100}
 ]
 , {k1, 0, 10}
 , {k2, 0, 10}
 ]
$\endgroup$

1 Answer 1

8
$\begingroup$

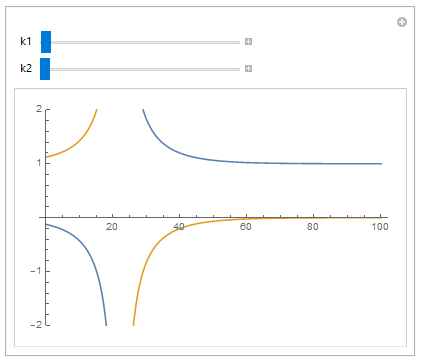
A rule ( -> ) does not work like a function definition here. If you instead define x and u as functions of t, k1 and k2 the plot works as you would like. It is also useful to set the PlotRange so it does not automatically rescale with the function.

x[t_, k1_, k2_] := 
  1 - (-1 + k2*E^(k1*t + k1))/(-1 + k1*E^(k1*t + k1) + 
      k2*E^(k1*t + k1));
u[t_, k1_, k2_] := (-1 + k2*E^(k1*t + k1))/(-1 + E^(k1*t + k1)*k1 + 
    E^(k1 t C[1] + k1 C[1] C[2])*k2)

Manipulate[
  Plot[
    {x[t, k1, k2], u[t, k1, k2]}, 
    {t, 0, 100}, 
    PlotRange -> {-2, 2}
  ], 
  {k1, 0, 10}, 
  {k2, 0, 10}
]

Manipulate

$\endgroup$
1
  • $\begingroup$ @Iowriniak Thanks a lot! $\endgroup$ Commented Nov 21, 2016 at 15:46

Your Answer

By clicking “Post Your Answer”, you agree to our terms of service and acknowledge you have read our privacy policy.

Not the answer you're looking for? Browse other questions tagged or ask your own question.