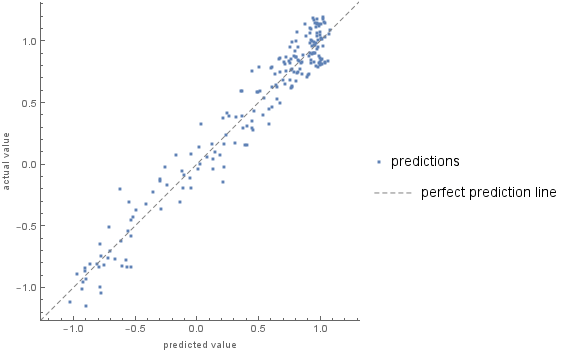
I'm trying to combine a PredictorMeasurements["ComparisonPlot"] plot with another plot, but the problem is that the plot generated by PredictorMeasurements has plot markers that are far too large. Any way to change them?
1 Answer
$\begingroup$
$\endgroup$
Using an example from the docs
points = {##, Cos[#1*#2] + RandomReal[{-.2, .2}]} & @@@ RandomReal[{-2, 2}, {1000, 2}];

trainingset = {#1, #2} -> #3 & @@@ points[[;; 800]];
testset = {#1, #2} -> #3 & @@@ points[[801 ;;]];
p = Predict[trainingset];
pm = PredictorMeasurements[p, testset];
cp = pm["ComparisonPlot"]

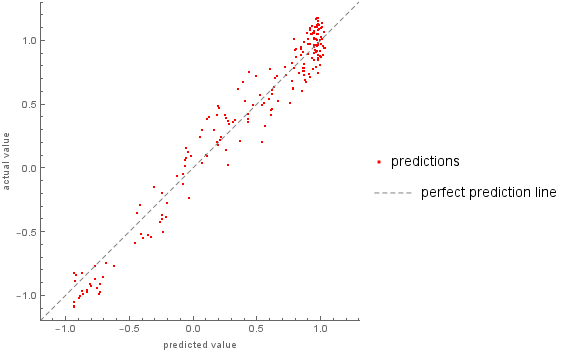
Post-process cp to change the directives like PointSize and color:
cp /. {{dir___, p:Point[___]}:>{dir, PointSize[Tiny], Red, p},
      pl:PointLegend[__]:>(pl /. RGBColor[___]:>Red)}


PredictorMeasurements[p, testset, "ComparisonPlot" ]/. PointSize[_]:>PointSize[Tiny]? $\endgroup$PredictorMeasurements[p, testset, "ComparisonPlot" ]/. {PointSize[_]:>PointSize[Tiny],PlotStyle[_]:>PlotStyle[Red]}$\endgroup$