I'm attempting a simple Plot that I want to add asymptote markers to:
Module[{p, g},
 p = Plot[1/Sqrt[1 - x^2/4], {x, -2, 2},
   PlotRange -> {{-2.2, 2.2}, {0, 5}}];
 g = Graphics[{Line[{{2, 0}, {2, 5}}], Line[{{-2, 0}, {-2, 5}}]}];
 {p, Show[g, p]}]
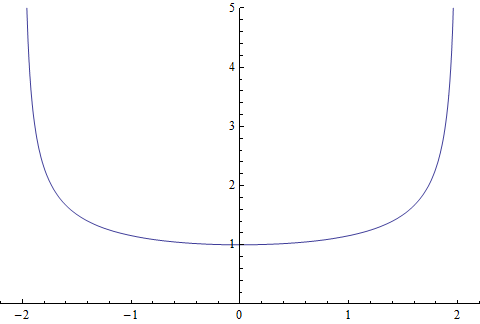
With just the plot I get my tick marks

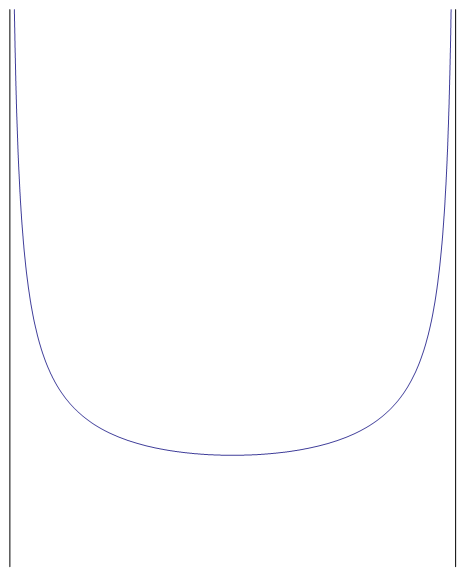
However, when I combine the plot and the pair of lines:

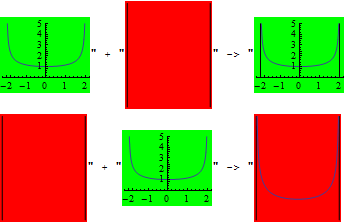
the tick marks on my axes disappear? Observe that it even the vertical ticks are gone, so this isn't an issue of them being pushed off the combined image.

