6
$\begingroup$

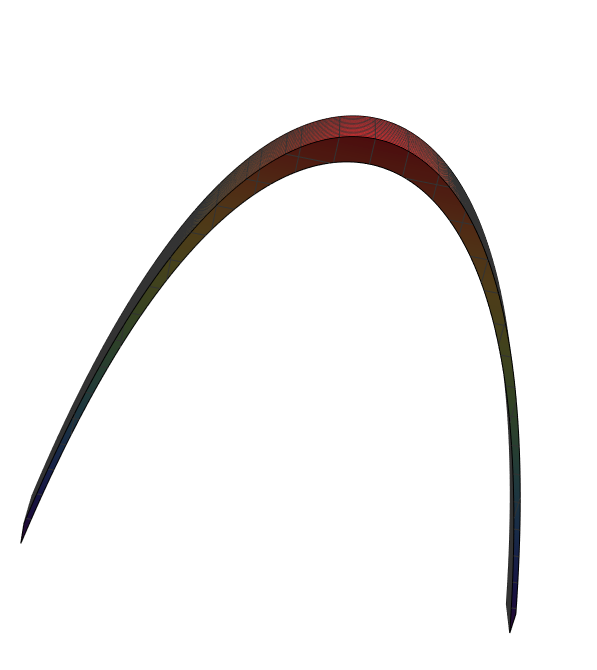
I am drawing a 3D surface with the following code:

S1 = 
  Plot3D[-69*(Cosh[(3*x)/299] - 1) + 200, {x, -200, 200}, {y, -1, 1}, 
    Mesh -> None, 
    BoxRatios -> {1, .1, 1}, 
    ColorFunction -> "Rainbow", 
    PlotPoints -> 40, 
    PlotStyle -> Thickness[10]];
Show[{S1}, Boxed -> False, Axes -> False]

As you can see, I am attempting to increase the thickness of the function with the following term:

PlotStyle -> Thickness[10]

Yet, this does nothing. It stays thin. I have also tried changing the constant from 10 to .01. But this does nothing too. I have browsed the Wolfram documentation page and this forum, but I cannot quite find a solution. I appreciate any help with this.

$\endgroup$
2
  • $\begingroup$ Thickness is—I think—for lines, not for surfaces. You might consider using RegionPlot3D or using the Filling option instead. $\endgroup$ Commented Jul 28, 2016 at 23:24
  • $\begingroup$ There is an answer to this question found here $\endgroup$ Commented Jul 28, 2016 at 23:39

2 Answers 2

13
$\begingroup$

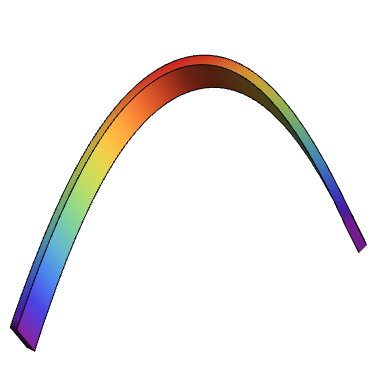
You can use Extrusion:

S1 = Plot3D[-69*(Cosh[(3*x)/299] - 1) + 200, {x, -200, 200}, {y, -1, 1}, 
 Mesh -> None, BoxRatios -> {1, .1, 1}, 
 ColorFunction -> "Rainbow", PlotPoints -> 40, Extrusion -> 10];
Show[{S1}, Boxed -> False, Axes -> False]

enter image description here

Related:

Sharp Edges in ContourPlot3D with Thickness setting

$\endgroup$
3
  • $\begingroup$ Woah, I don't think I'd seen that before! Very cool. $\endgroup$ Commented Jul 29, 2016 at 0:33
  • 1
    $\begingroup$ @Young I am unable to find a reference to Extrusion in the documentation. Can you find it there? $\endgroup$ Commented Jul 29, 2016 at 1:23
  • 1
    $\begingroup$ @JackLaVigne I think it's an undocumented option $\endgroup$
    – Young
    Commented Jul 29, 2016 at 1:30
3
$\begingroup$

I would try RegionPlot3D for this kind of work, depending on exactly what you're trying to generate (could we get more details?).

For example, you could try something like:

S1 = RegionPlot3D[-69*(Cosh[(3*x)/299] - 1) + 195 <= 
z <= -69*(Cosh[(3*x)/299] - 1) + 205, {x, -200, 200}, {y, -1, 
1}, {z, 0, 205}, BoxRatios -> {1, .1, 1}, 
ColorFunction -> "Rainbow", PlotPoints -> 120, 
AxesLabel -> {"x", "y", "z"}];
Show[{S1}, Boxed -> False, Axes -> False]

Which gives regionplot3d structure

$\endgroup$
1
  • $\begingroup$ Thank you guys! It's now working. $\endgroup$ Commented Jul 29, 2016 at 23:09

Not the answer you're looking for? Browse other questions tagged or ask your own question.