The following code produces the graph of $f(x)=\frac{1}{x-1}$ correctly.
 Plot[1/(x - 1), {x, -5, 5}, PlotRange -> {{-5, 5}, {-5, 5}},
 PlotStyle -> {Thick}, BaseStyle -> {FontSize -> 14},
 Exclusions -> {x - 1 == 0},
 ExclusionsStyle -> Directive[Red, Dashed]]
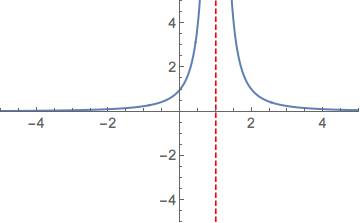
However, when I try to graph $f(x)=\frac{1}{(x-1)^2}$ with essentially the same code, I lose the vertical asymptote.
Plot[1/(x - 1)^2, {x, -5, 5}, PlotRange -> {{-5, 5}, {-5, 5}},
PlotStyle -> {Thick}, BaseStyle -> {FontSize -> 14},
Exclusions -> {(x - 1)^2 == 0},
ExclusionsStyle -> Directive[Red, Dashed]]
I have tried all sorts of permutations of writing the exclusions, but nothing seems to work! From what I can tell, whenever I try to graph a rational function that has a factor in the denominator with an even power, the vertical asymptote fails to draw.
Any help would be greatly appreciated!

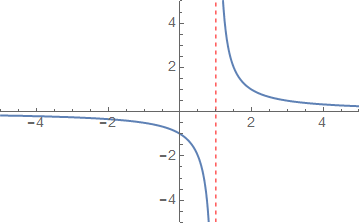
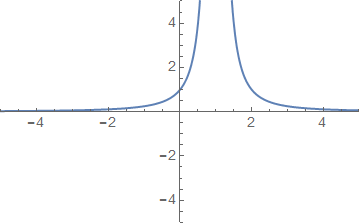
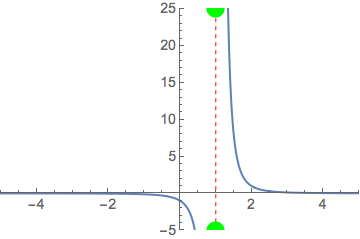
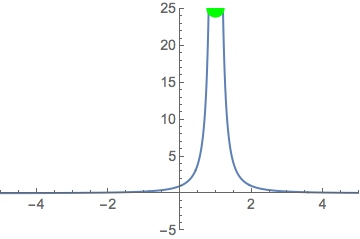
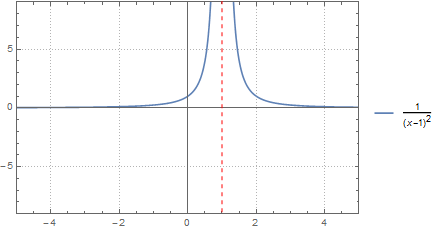
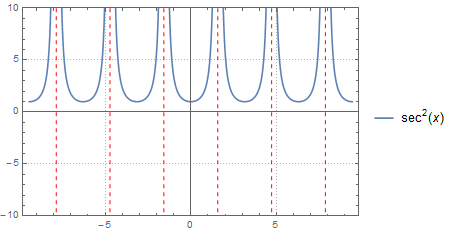
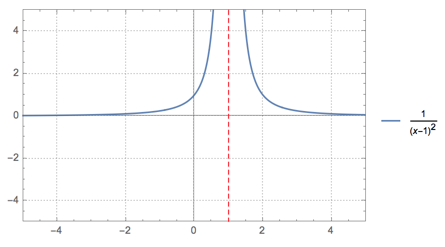
Exclusion"connects" your singularities... So in the first case it connects two points $(1,-\infty)$ and $(1,+\infty)$, in the second case there is just one point $(1,+\infty)$, so no line is visible... $\endgroup$