I've been beating my face against the desk for awhile trying to figure this out, and it's driving me absolutely nuts!
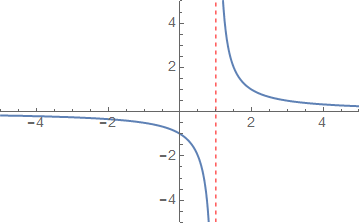
The following code produces the graph of $f(x)=\frac{1}{x-1}$ correctly.
 Plot[1/(x - 1), {x, -5, 5}, PlotRange -> {{-5, 5}, {-5, 5}},
 PlotStyle -> {Thick}, BaseStyle -> {FontSize -> 14},
 Exclusions -> {x - 1 == 0},
 ExclusionsStyle -> Directive[Red, Dashed]]
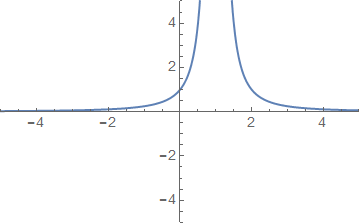
However, when I try to graph $f(x)=\frac{1}{(x-1)^2}$ with essentially the same code, I lose the vertical asymptote.
Plot[1/(x - 1)^2, {x, -5, 5}, PlotRange -> {{-5, 5}, {-5, 5}},
PlotStyle -> {Thick}, BaseStyle -> {FontSize -> 14},
Exclusions -> {(x - 1)^2 == 0},
ExclusionsStyle -> Directive[Red, Dashed]]
I have tried all sorts of permutations of writing the exclusions, but nothing seems to work! From From what I can tell, whenever I try to graph a rational function that has a factor in the denominator with an even power, the vertical asymptote fails to draw.
Any help would be greatly appreciated!


