3
$\begingroup$

I'm trying to simply overlay some text and a scalebar onto an image. I'm getting (what I perceive to be) completely ridiculous results while trying to do this.

Here's the code:

img = Import@"http://i.imgur.com/PVUXYz5.png"

Manipulate[
overlay = 
Graphics[{Text[Style["50 Magnets", White, 30], {250, 250}], {White,
   AbsoluteThickness[5], Line[{{i, 200}, {i + 50, 200}}]}}];, 
{i, 1, 450, 1}]

Dynamic@Overlay[{img, overlay}]

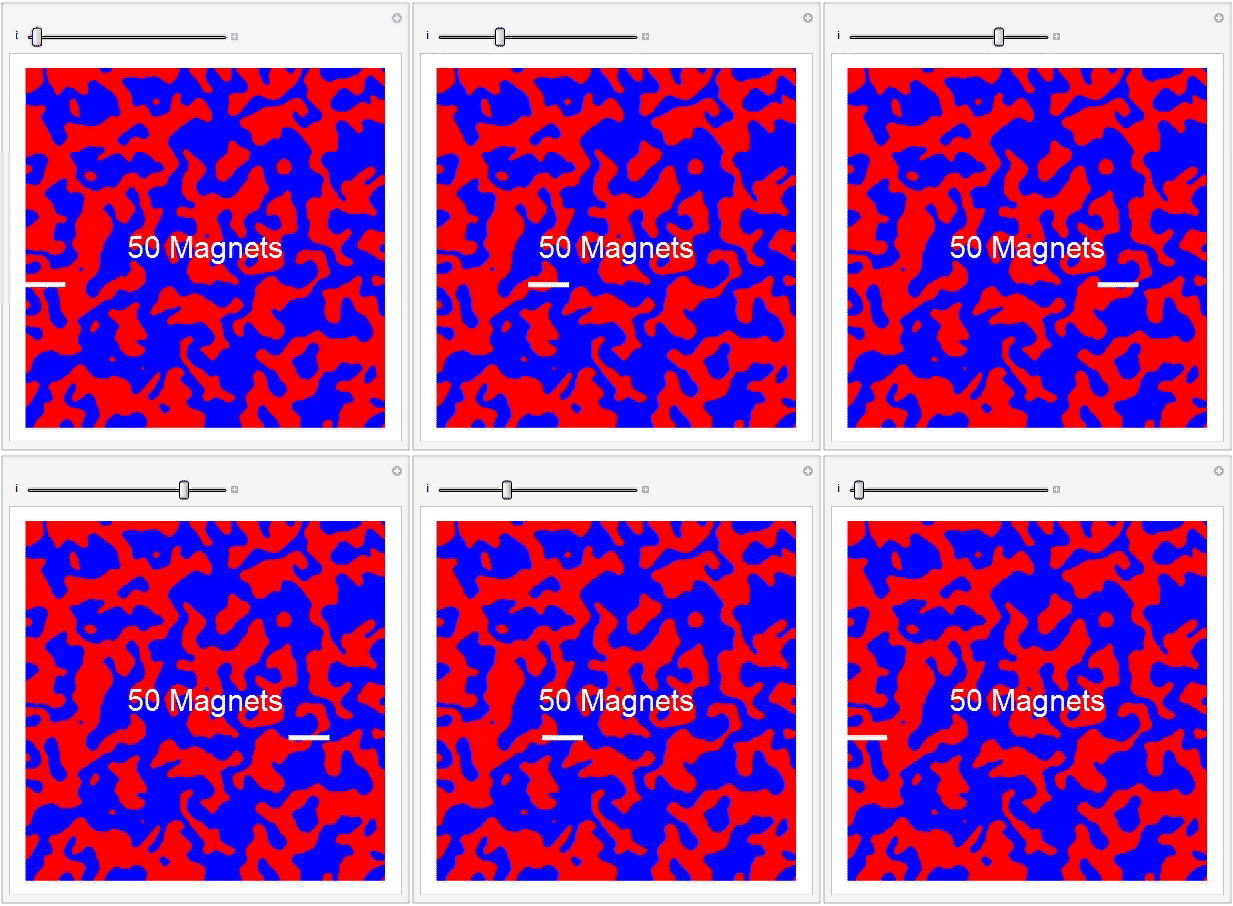
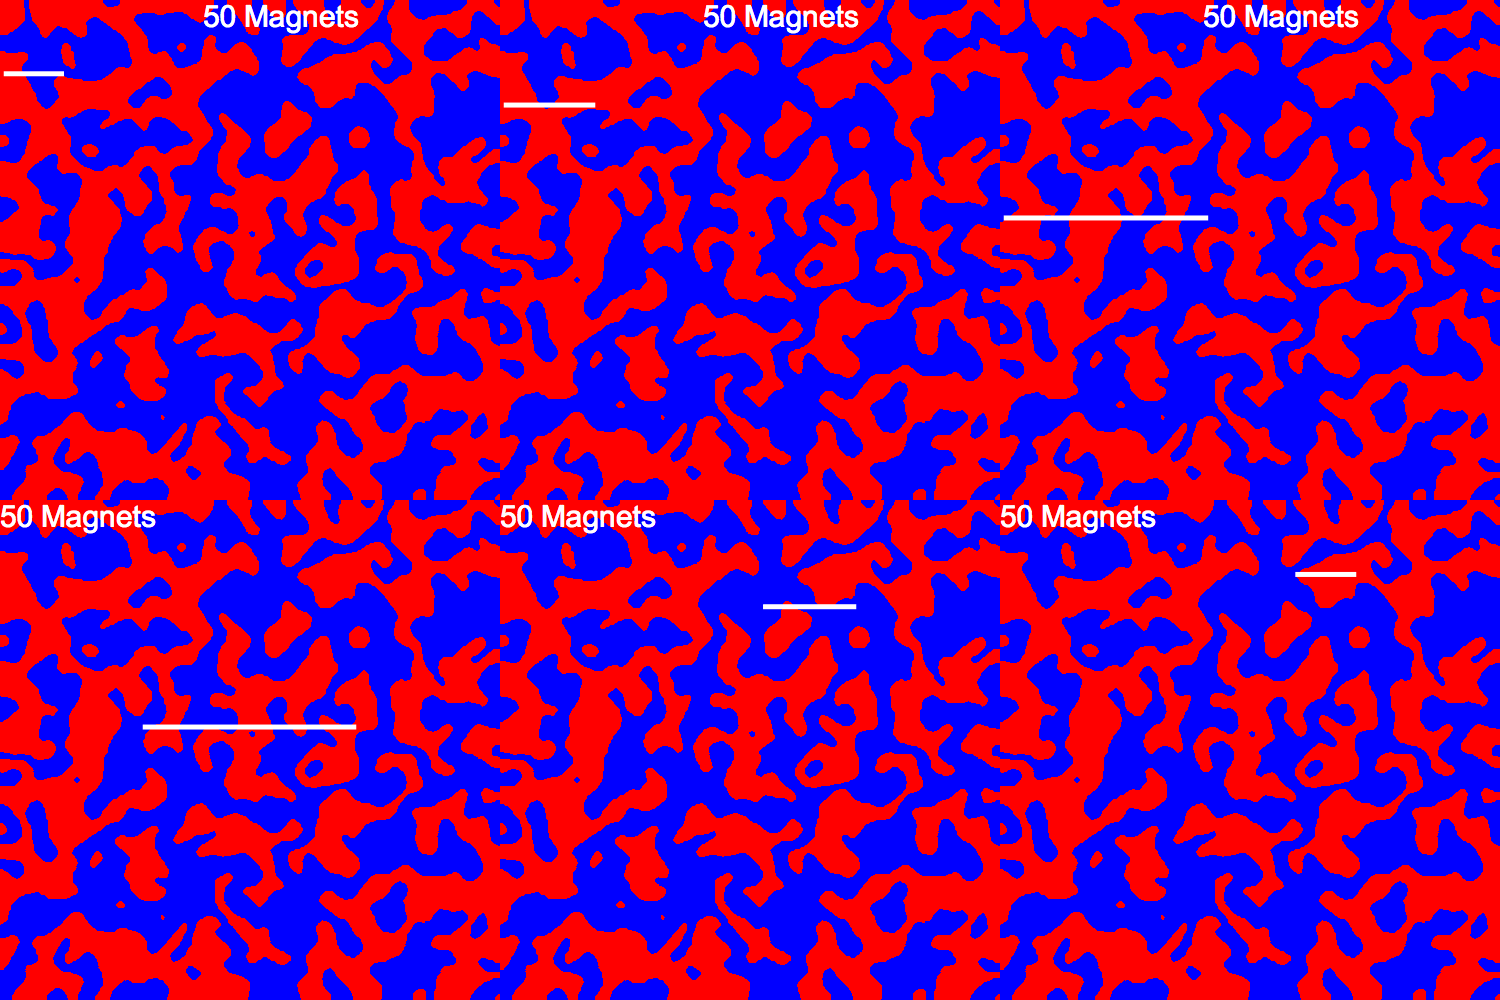
The only thing I'm Manipulateing, as far as I can see, is the x-values of the points where I'd like my Line to show up. When I increase i, I expect the Line just to move from left to right. Instead, the line shrinks and grows in size and translates around.

nonsense graphics

Not only that, but the Text moves around, too! I cannot for the life of me see why this is happening. I expect that I have a misunderstanding of how Graphics is working, but even breaking it up into two Graphics objects and combining them with Show results in the exact same behavior.

Does anybody know why this happens and what I could do to fix it? Ostensibly, adding two words and a line to an image (and mapping this operation to a list of images once I figure this out) shouldn't be difficult, but this may be the oddest behavior I've ever seen from Mathematica and I'm just totally clueless.

$\endgroup$
3
  • 1
    $\begingroup$ use the option PlotRange in Graphcis;, e.g., PlotRange -> {{0, 500}, {0, 500}}? $\endgroup$
    – kglr
    Commented Jun 8, 2016 at 23:57
  • $\begingroup$ You know, that's a great idea. I know that Plots, et c. are Graphics objects, but never thought about how that implied that I could use PlotRange on other Graphics objects. I think that that does, in fact, work, but now while the Line shows up in the right place, the image is (as it was before) improperly scaled and so the line/text don't show up where they ought to. ImageDimensions returns 500x500, but that's not how it's rendering. Even forcing ImageSize doesn't change it. $\endgroup$ Commented Jun 9, 2016 at 0:18
  • $\begingroup$ Your graphic makes my eyes bleed. $\endgroup$ Commented Jun 9, 2016 at 13:21

1 Answer 1

8
$\begingroup$

In addition to @kglr comment. I would recommend placing all in a single Manipulate and making use of Prolog for the img background. The Graphic is actually resetting its PlotRange as it is redrawn. This is why you need to set it as constant.

Manipulate[
 Graphics[{
   Text[Style["50 Magnets", White, 30], {250, 250}],
   {White, AbsoluteThickness[5], Line[{{i, 200}, {i + 50, 200}}]}},
  PlotRange -> Transpose@{{0, 0}, ImageDimensions@img},
  Prolog -> {Inset[img, Center, Center, ImageDimensions@img]}],
 {i, 1, 450, 1}]

enter image description here

Hope this helps.

$\endgroup$
2
  • $\begingroup$ That definitely helps a ton; I think that'll let me get to where I need to be. Thanks a ton, and thanks to @kglr for pointing out the PlotRange thing! $\endgroup$ Commented Jun 9, 2016 at 0:26
  • $\begingroup$ One thing I don't understand (cf. the comment on my original post) is why the sizes are so messed up. Everything now scales properly, but the result of this Manipulate command is a 540x540 image—I dunno from where it gets that number. When I set the ImageSize in Graphics to {500,500}, it renders at 750x750. I wonder if this is because I have the default notebook magnification set to 1.5x due to my display's resolution... I figure it'll export properly though with a forced ImageSize, so no worries. $\endgroup$ Commented Jun 9, 2016 at 0:55

Your Answer

By clicking “Post Your Answer”, you agree to our terms of service and acknowledge you have read our privacy policy.

Not the answer you're looking for? Browse other questions tagged or ask your own question.