17
$\begingroup$

Let's say I have a Histogram:

Histogram[RandomVariate[NormalDistribution[10, 2], 500]]

Histogram

and I want the bars positioned to the left of 8 on the horizontal axis to be a different colour.

The Mathematica documentation shows how to do this for the height of bars, but not for their position:

Histogram[RandomVariate[NormalDistribution[10, 2], 500], 
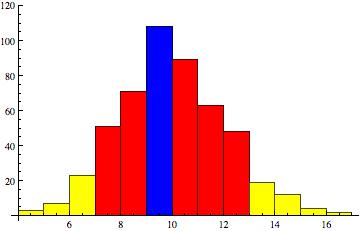
 ColorFunction -> (Which[# < 40, Yellow, 40 <= # < 90, Red, True, Blue] &),
  ColorFunctionScaling -> False]

Histogram2

How do I call the positions of the bars from Histogram and put them into my ColorFunction?

$\endgroup$
1
  • $\begingroup$ You will probably need to get the bin data with HistogramList and plot it with BarChart -- I don't have HistogramList in v7 or I'd make this an answer. $\endgroup$
    – Mr.Wizard
    Commented Oct 6, 2012 at 10:12

2 Answers 2

16
$\begingroup$

You can use a custom ChartElementDataFunction as follows:

cedF[{{xmin_, xmax_}, {ymin_, ymax_}}, ___] :={If[xmax <= 8, 
      RGBColor[1, 0, 0], Sequence[]],
   Dynamic@EdgeForm[Directive[Thickness[.015], Lighter@CurrentValue["Color"]]],
   Rectangle[{xmin, ymin}, {xmax, ymax}, RoundingRadius -> 5]};
Histogram[RandomVariate[NormalDistribution[10, 2], 500],ChartStyle -> "Pastel", 
  ChartElementFunction -> cedF]
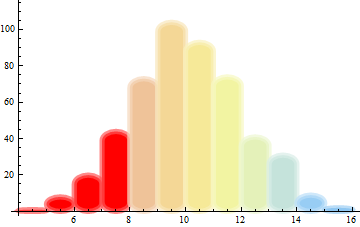
enter image description here

EDIT: Adding arguments to cedf:

cedf2[from_,to_,color_: Red, t_:Small, rr_: 0][{{xmin_, xmax_}, {ymin_, ymax_}}, ___] :=
 {If[from < xmax <= to, color, Sequence[]],
   Dynamic@EdgeForm[Directive[Thickness[t], Lighter@CurrentValue["Color"]]],
   Rectangle[{xmin, ymin}, {xmax, ymax}, RoundingRadius -> rr]}

 Histogram[RandomVariate[NormalDistribution[10, 2], 500], ChartStyle -> "Pastel", 
   ChartElementFunction -> cedf2[6, 10, Purple, Small, 3]]

enter image description here

Alternatively, you can build a custom data function using the built-in ChartElementDataFunctions:

sgmntsclF = ChartElementDataFunction["SegmentScaleRectangle", 
    "Segments" -> 8, "ColorScheme" -> "TemperatureMap"];
grdntrctF = ChartElementDataFunction["GradientRectangle", 
    "ColorScheme" -> "Rainbow", "GradientOrigin" -> Top];

Histogram[RandomVariate[NormalDistribution[10, 2], 500], ChartStyle -> "Pastel",
 ChartElementFunction -> ((If[7 < #[[1, 2]] <= 10, sgmntsclF[##], grdntrctF[##]]) &)]

enter image description here

$\endgroup$
5
  • $\begingroup$ I didn't think of this approach. Slick! $\endgroup$
    – Mr.Wizard
    Commented Oct 6, 2012 at 15:53
  • $\begingroup$ Great. If I wanted to generalise this, how would I go about doing it? i.e. instead of just specifying that bins to the left of X should be red, what about a list specifying a separate colour for each bin? $\endgroup$
    – Ooku
    Commented Oct 11, 2012 at 8:26
  • $\begingroup$ Ooku, the simplest way would be using ChartStyle->{{color1,color2,...}} which colors each bar with the corresponding color in the list. If the list of colors is shorter than the number of bins, it cycles through the colors. For example: Histogram[RandomVariate[NormalDistribution[0, 1], 500], ChartStyle -> {ColorData["Atoms", "ColorList"][[;; 70]]}]. If you need a more general version of cedf2 that accepts a list of triples {{from1,to1,color1},{from2,to2,color2}...} I will update with an example of how it can be done. $\endgroup$
    – kglr
    Commented Oct 11, 2012 at 10:16
  • $\begingroup$ @kglr wow! can you explain the input of cedF[{{xmin_, xmax_}, {ymin_, ymax_}}, ___] function ? What is ___ ? $\endgroup$
    – user305883
    Commented Nov 16, 2018 at 20:00
  • 1
    $\begingroup$ @user305883, BlankNullSequence (___) stands for any sequence of zero or more arguments. $\endgroup$
    – kglr
    Commented Nov 16, 2018 at 20:04
5
$\begingroup$

You will probably need to get the bin data with HistogramList and plot it with BarChart.

I don't have HistogramList in v7, but here is a basic proof of concept:

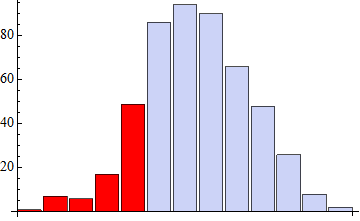
hist = Histogram[RandomReal[NormalDistribution[10, 2], 500]]

Cases[hist, RectangleBox[{a_, _}, {b_, x_}] :> {b, x}, -1];

If[# <= 8, Style[#2, Red], #2] & @@@ %;

BarChart @ %

Mathematica graphics

Mathematica graphics


I'm flying blind here as I can't test this, but maybe it works:

dat = HistogramList[RandomVariate[NormalDistribution[10, 2], 500]];

If[# <= 8, Style[#2, Red], #2] & @@@ Transpose @ dat;

BarChart @ %
$\endgroup$
4
  • $\begingroup$ The Cases[] bit doesn't work for me (v8), can you explain what the -1 at the end is doing? $\endgroup$
    – Ooku
    Commented Oct 6, 2012 at 10:31
  • $\begingroup$ @Ooku I was afraid there was too much change between versions. :-/ -1 in Cases just specifies searching for the pattern all the way to the bottom level. Apparently RectangleBox is either no longer used, or used with a different syntax. Cases should return a list of the right $x$ coordinate and top $y$ coordinate for each bar, e.g. {{3, 1}, {5, 4}, {6, 7}, {7, 24}, {8, 47}, {9, 86}, {10, 95}, {11, 94}, {12, 71}, {13, 37}, {14, 25}, {15, 6}, {16, 3}} $\endgroup$
    – Mr.Wizard
    Commented Oct 6, 2012 at 10:38
  • $\begingroup$ @Ooku I think this would be similar to HistogramList[ . . . ] // Transpose -- please try that. $\endgroup$
    – Mr.Wizard
    Commented Oct 6, 2012 at 10:40
  • $\begingroup$ @Ooku I added some code for you to try. $\endgroup$
    – Mr.Wizard
    Commented Oct 6, 2012 at 10:42

Your Answer

By clicking “Post Your Answer”, you agree to our terms of service and acknowledge you have read our privacy policy.

Not the answer you're looking for? Browse other questions tagged or ask your own question.