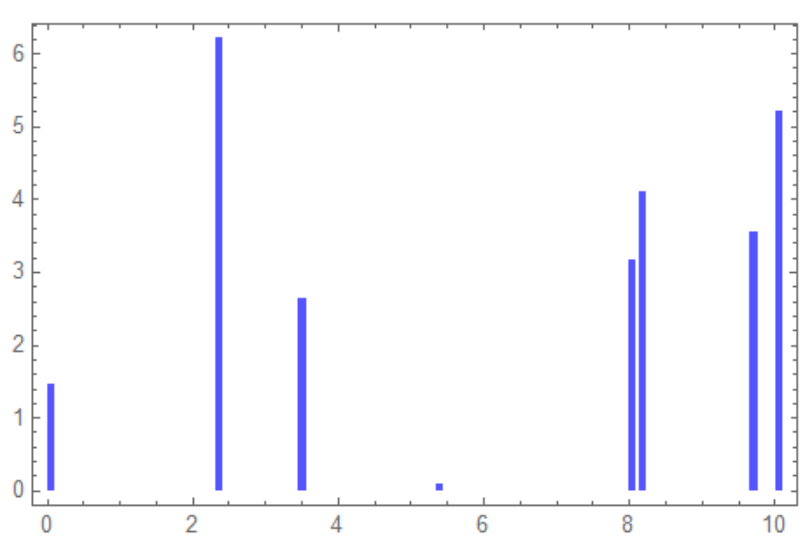
Let's consider the following simple data set
data = {{0,1.48},{1,0},{2.3,6.22},{3.1,0.01},{3.45,2.66},{5.34,0.11},
        {7.98,3.18},{8.12,4.11},{8.32,0},{9.65,3.56},{10,5.22}};
The list contains pairs $(x,y)$. I want to use this data for creating a histogram where the $x$ values are the horizontal values of the histogram, while the corresponding $y$ values indicate the height of the respective bar of the histogram. I also should be able to control the width of the bars, let's say to be equal to 0.001.
Any suggestions on how to create the desired histogram?


ListPlotis not what I want. What I want is a real histogram where I can control the width of the boxes. $\endgroup$