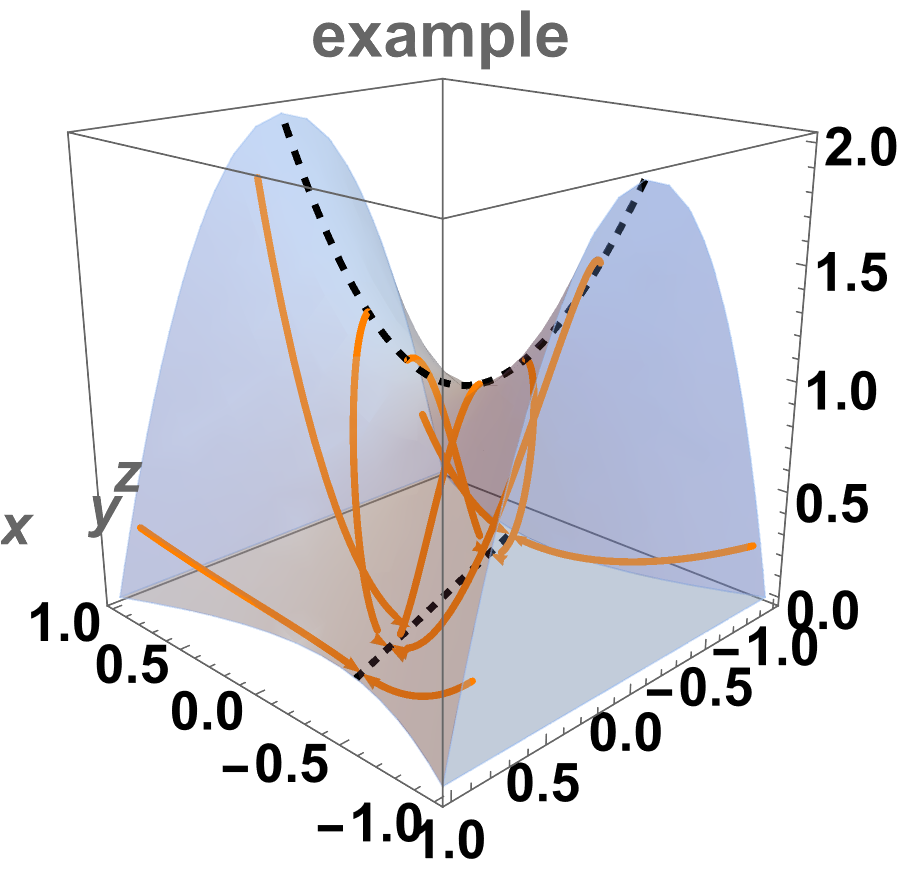
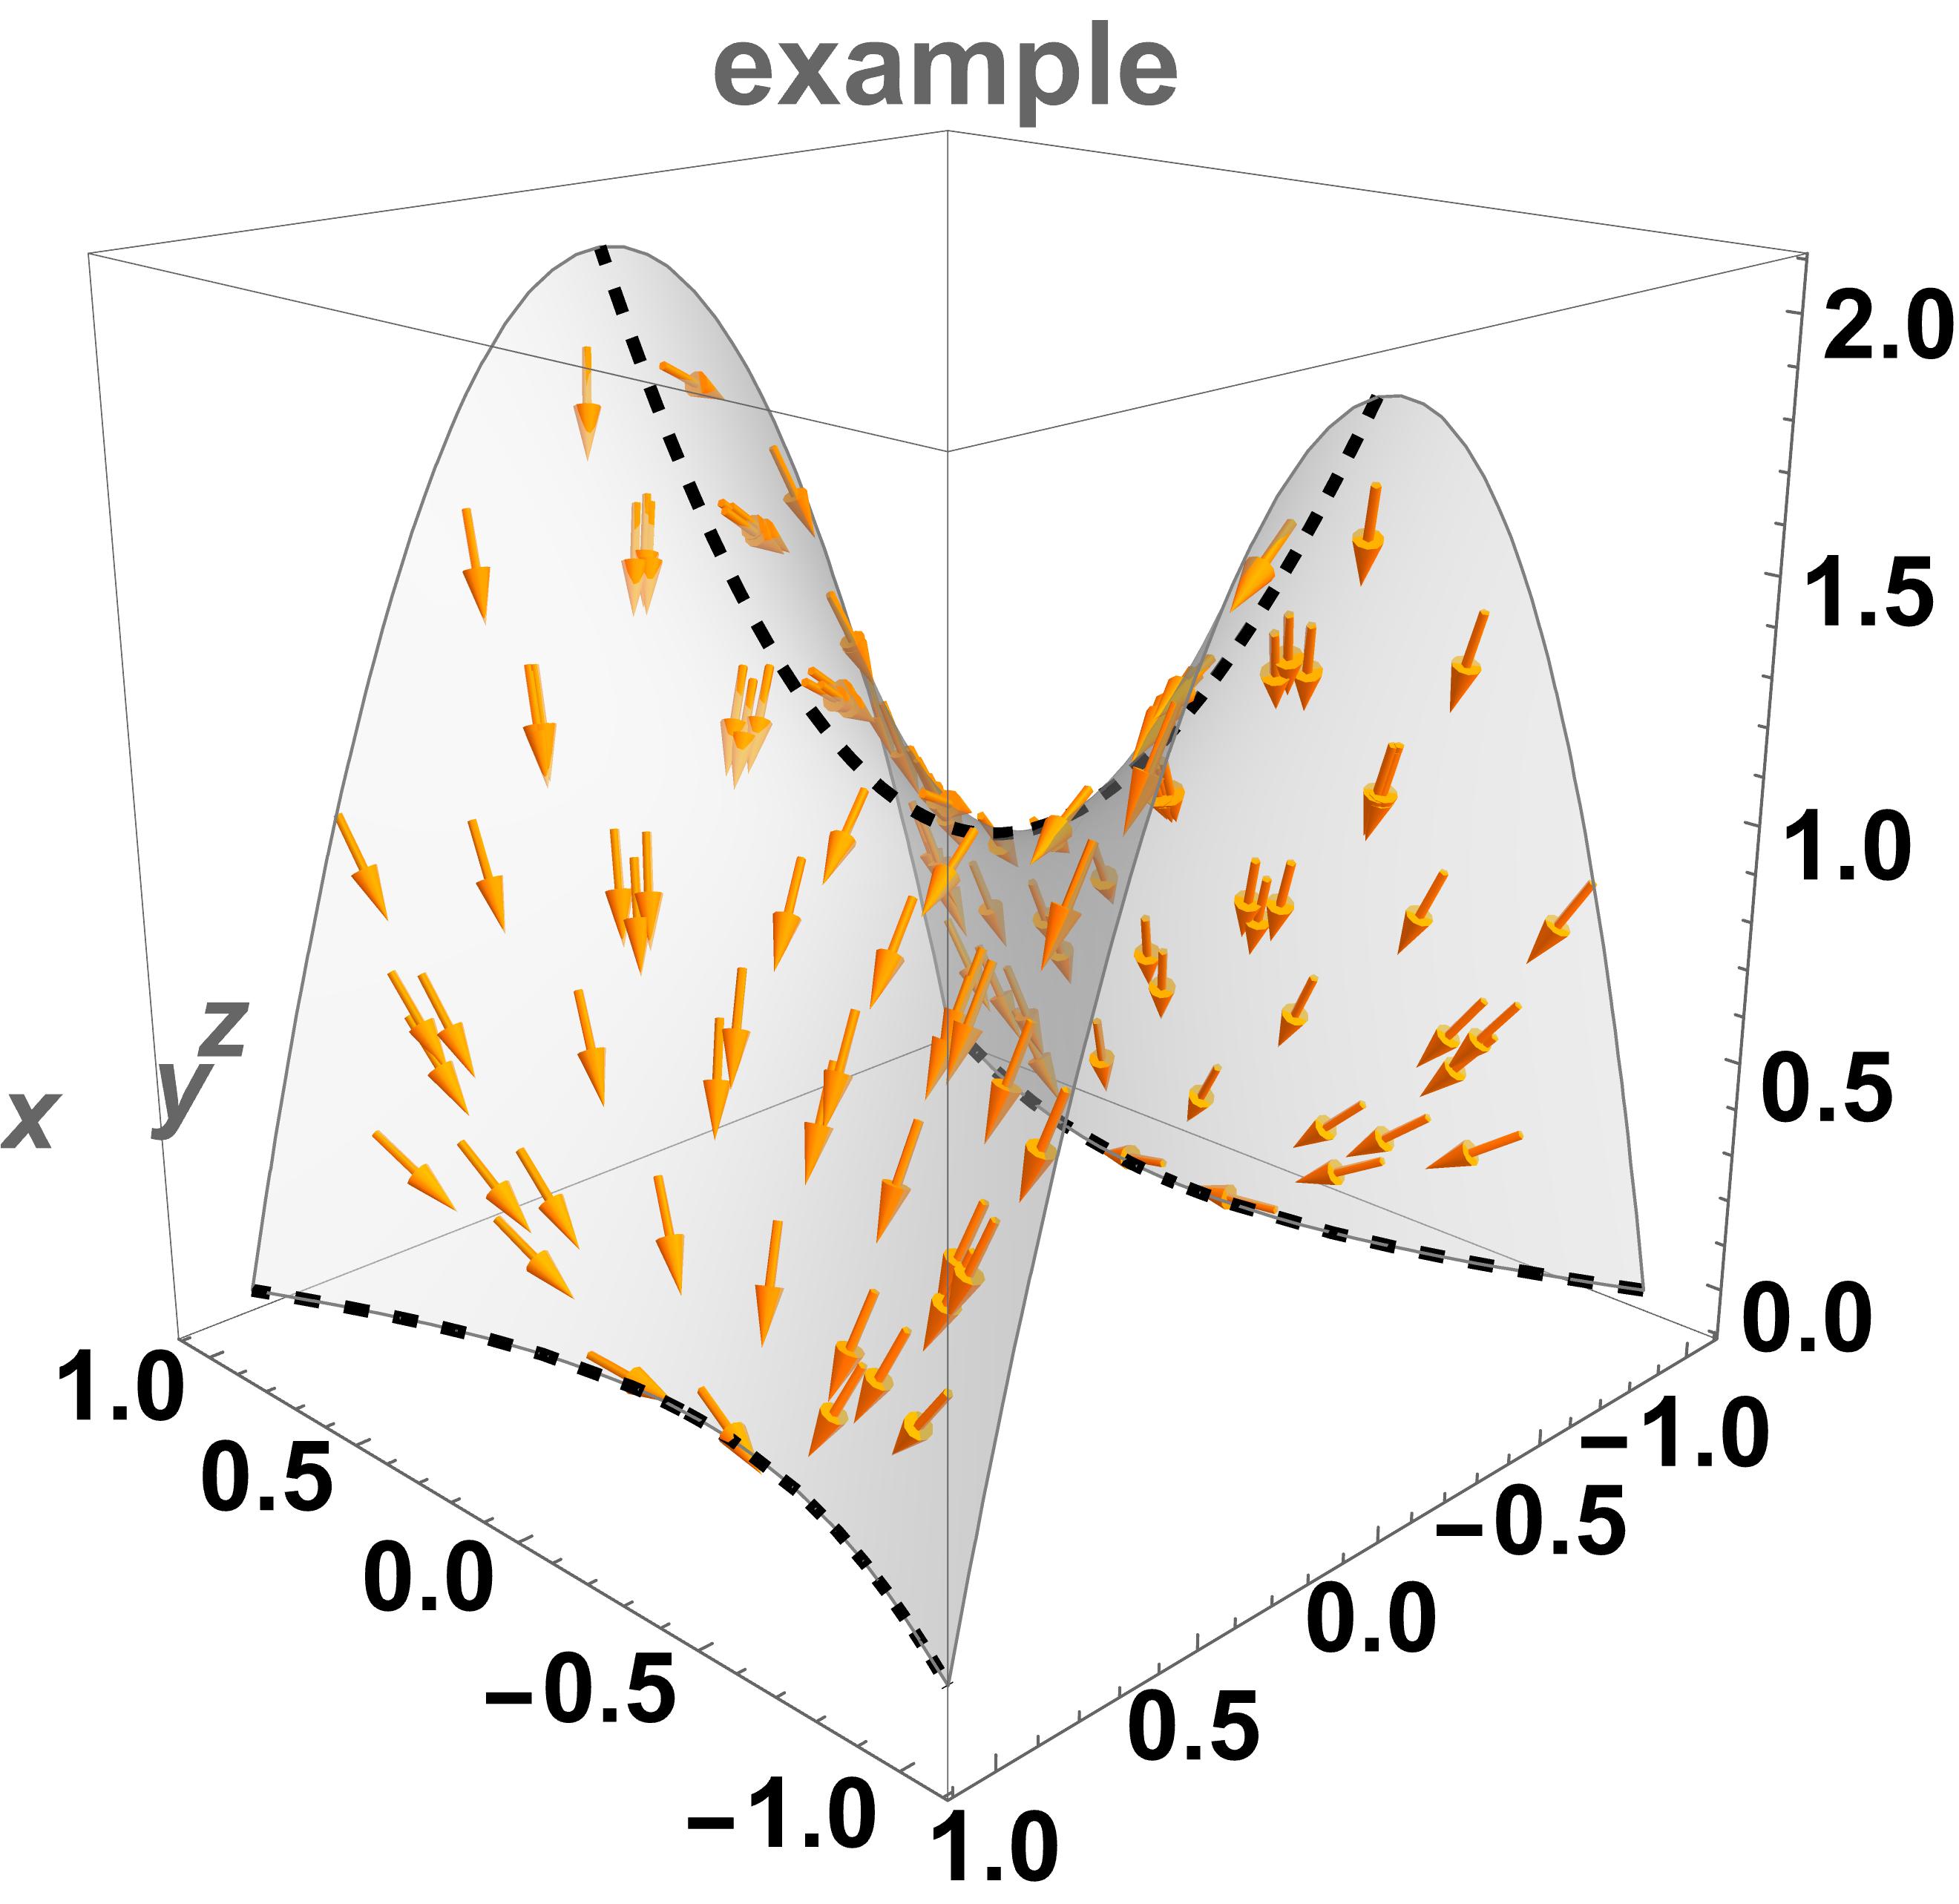
I am using the StreamPlot3D function from Wolfram Mathematica for the following system
- $x'=\left(-x^2-1\right) (3 x+y)+3 x z$
- $y'= 3 y z-x y (3 x+y)$
- $z'= z (6 (z-1)-2 x (3 x+y)),$
with the following restriction $-x^2+2y^2+z=1.$
I am using the RegionFunction option of StreamPlot3D to plot on the inside of the restriction, that is $-x^2+2y^2+z\leq 1$ or RegionFunction -> Function[{x, y, z}, -x^2 + 2 y^2 + z <= 1]
Is there a way to plot the lines on the surface of the restriction i.e. the hyperbolic paraboloid?
I don't see any way to do it in the documentation or in the help for the StreamPlot3D function. I tried defining the region function to ==1 but it does not work. The closest thing i have seen is this link: Mapping StreamPlot onto spherical surfaces
But they go from a 2D system to a 3D projection on a sphere, I do have a 2D version of this system solving the restriction for z and I have 2D plots for this but I cannot define the quadric surface properly to make it work like in that example. As requested here is the code I am using
Show[StreamPlot3D[{(-1 - x^2) (3 x + y) + 3 x z, -x y (3 x + y) +3 y z, (-2 x (3 x + y) + 6 (-1 + z)) z}, {x, -1, 1}, {y, -1, 1}, {z, 0, 2}, Axes -> True, AxesLabel -> {x, y, z}, LabelStyle -> Directive[Bold, 15], AxesStyle -> Directive[ 16], StreamPoints -> 20, StreamMarkers -> "Arrow", StreamScale -> {Full, 20, 0.1}, StreamColorFunction -> None, StreamStyle -> Orange, RegionFunction -> Function[{x, y, z}, - x^2 + 2 y^2 + z <= 1], ImageSize -> 300, PlotLabel -> "example"], ParametricPlot3D[{x, 0, 1 + x^2}, {x, -1, 1}, RegionFunction -> Function[{x, y, z}, (- x^2 + 1 - x^2 <= 1)], PlotStyle -> {Black, Thick, Dashed}], ParametricPlot3D[{x, -3 x, 0}, {x, -1, 1}, RegionFunction -> Function[{x, y, z}, (- x^2 + 2 (y)^2 + z <= 1)], PlotStyle -> {Black, Thick, Dashed}], ViewPoint -> {-2, 2, 1}]
Thanks in advance for the help.


