0
$\begingroup$

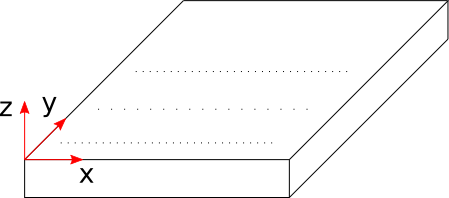
I want to Plot a surface using ListPlot3D. The Data used to feed the Plot is generated from measurments. The Problem is, sometimes the measurments generates x number of points for one row. Another time the measurments produces only y number of points. For better understanding, one dot in the sketch represents one measuring point.

Sketch of the measured Surface

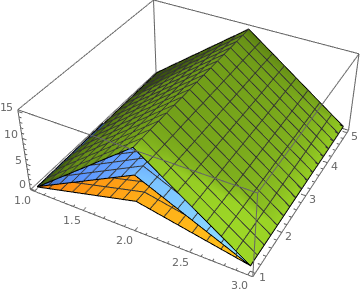
When trying to plot the surface, ListPlot3D treats every row as a single surface and so the result looks like this.

Result when using ListPlot3D

I created a little example that hopefully show's the Error.

Data = {{{0.1, 5, 0.9}, {0.2, 5, 0.87}, {0.3, 5, 0.89 }, {0.4, 5, 
    0.82}, {0.5, 5, 0.85}}, {{0.5/3, 10, 0.85}, {2 0.5/3, 10 , 
    0.88}, {3 0.5/3, 10 , 0.86}}, {{0.1, 15, 0.9}, {0.2, 15, 
    0.87}, {0.3, 15, 0.89 }, {0.4, 15, 0.82}, {0.5, 15, 0.85}}};

MyError = ListPlot3D[Table[Data[[i]], {i, 3}], DataRange -> All]

$\endgroup$

1 Answer 1

3
$\begingroup$
Clear["Global`*"]

Data = {{{0.1, 5, 0.9}, {0.2, 5, 0.87}, {0.3, 5, 0.89}, {0.4, 5, 0.82}, {0.5, 
     5, 0.85}}, {{0.5/3, 10, 0.85}, {2 0.5/3, 10, 0.88}, {3 0.5/3, 10, 
     0.86}}, {{0.1, 15, 0.9}, {0.2, 15, 0.87}, {0.3, 15, 0.89}, {0.4, 15, 
     0.82}, {0.5, 15, 0.85}}};

Your Data is structured as three lists of points and you asked for it to be plotted as such.

Note that that result can also be obtained with the simpler

ListPlot3D[Data, DataRange -> All]

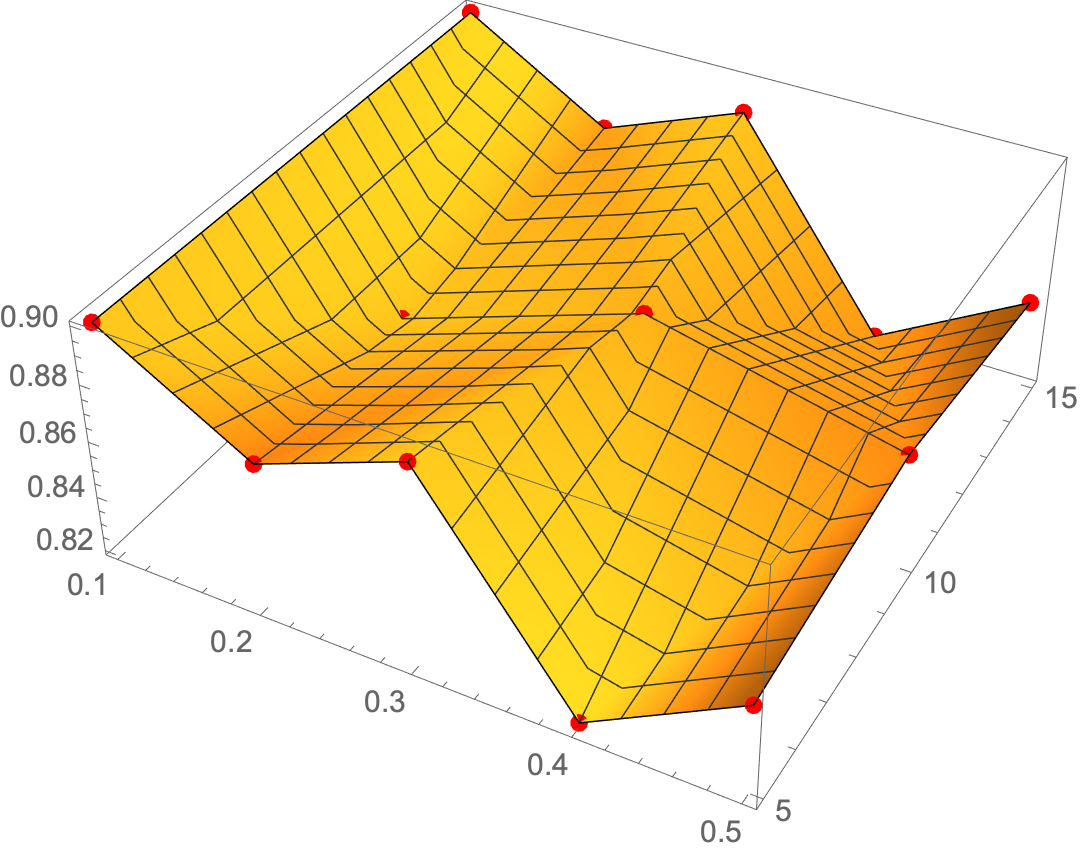
To obtain a single plot you want to Flatten your Data to a single list of points.

data2 = Data // Flatten[#, 1] &;

Show[
 ListPlot3D[data2], Graphics3D[{Red, AbsolutePointSize[6],
   Point[data2]}]]

enter image description here

$\endgroup$

Your Answer

By clicking “Post Your Answer”, you agree to our terms of service and acknowledge you have read our privacy policy.

Not the answer you're looking for? Browse other questions tagged or ask your own question.