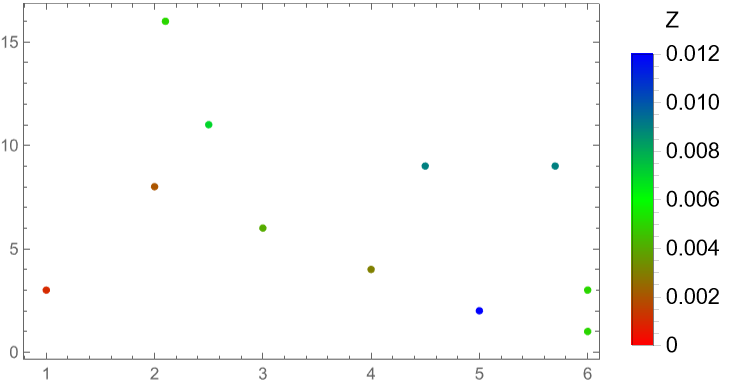
Data = Sort[{{1, 3, 0.001}, {3, 6, 0.004}, {5, 2, 0.012}, {6, 1,
     0.005}, {2, 8, 0.002}, {4, 4, 0.003}, {6, 3, 0.018}, {4.5, 9,
     0.009}, {2.5, 11, 0.007}, {2.1, 16, 0.005}, {5.7, 9, 0.009}}];


colorBar[arg_] := Blend[{Red, Green, Blue}, Rescale[arg, {0, 0.012}]];
ListPlot[Most /@ Data, PlotRange -> All,
 ColorFunction :>
  Function[{x, y},
   colorBar[
    Data[[Position[Data[[All, 1]],
        Nearest[Data[[All, 1]], x][[1]]][[1, 1]], 3]]]],
 ColorFunctionScaling -> False,
 PlotLegends ->
  BarLegend[{{Red, Green, Blue}, {0, 0.012}},
   LegendLayout -> "Column", Charting`TickSide -> Right,
   LabelStyle -> {FontSize -> 13, Black}, LegendMarkerSize -> 200,
   ColorFunctionScaling -> True, LegendLabel -> "Z"], Frame -> True]
A slightly modified (simplified) version
Data = Sort[{{1, 3, 0.001}, {3, 6, 0.004}, {5, 2, 0.012}, {6, 1,
     0.005}, {2, 8, 0.002}, {4, 4, 0.003}, {6, 3, 0.018}, {4.5, 9,
     0.009}, {2.5, 11, 0.007}, {2.1, 16, 0.005}, {5.7, 9, 0.009}}];
Dataf = Interpolation[Data];
colorBar[arg_] :=
  Blend[{Red, Green, Blue}, Rescale[arg, {0, 0.012}]];
ListPlot[Most /@ Data, PlotRange -> All,
 ColorFunction :> Function[{x, y}, colorBar[Dataf[x, y]]],
 ColorFunctionScaling -> False,
 PlotLegends ->
  BarLegend[{{Red, Green, Blue}, {0, 0.012}},
   ColorFunctionScaling -> True], Frame -> True]
Interpolation is used to find the value of Z for the selected values of {x,y}. Other than that, the code can remain the same.


