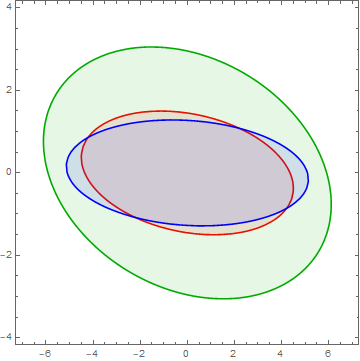
ContourPlot[
  {x^2 + 9 y^2 + 1.5 x y == 19,
   x^2 + 4 y^2 + x y == 35,
   x^2 + 16 y^2 + x y == 26},
  {x, -7, 7}, {y, -4, 4},
  ContourStyle -> {Red, Blue, Green}
]
2 Answers
$\begingroup$
$\endgroup$
3
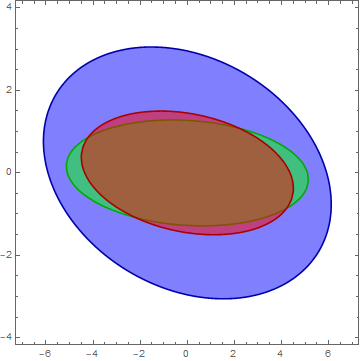
Here is an idea using RegionPlot:
Show@MapThread[
  RegionPlot[#1, {x, -7, 7}, {y, -4, 4},
    PlotStyle -> Directive[#2, Opacity[0.1]],
    BoundaryStyle -> #2
  ]&,
  {
    {x^2 + 9 y^2 + 3/2 x y <= 19, x^2 + 4 y^2 + x y <= 35, x^2 + 16 y^2 + x y <= 26},
    {Red, Darker@Green, Blue}
  }
]
As a note, at first I thought I could just use a single call to RegionPlot with the three equations and the appropriate PlotStyle -> {Red, Green, Blue}, BoundaryStyle -> {Red, Green, Blue}, but it seems that BoundaryStyle does not support multiple boundary specifications (the last one specified is the only one used). Perhaps I am misunderstanding there.
-
-
$\begingroup$ The problem is solved. Could you please edit or remove the plot(for copyright issues)? It would be highly appreciated if you do so. Please. $\endgroup$ Commented May 14, 2020 at 17:42
-
5$\begingroup$ @Sahabub 1) If you find that one of the answers provided here has solved your problem, you can indicate that by accepting upvoting it and accepting it (click gray checkmark by the answer). 2) What copyright issues are you trying to solve specifically? The content of this answer is available under the Creative Commons license CC BY-SA 4.0. $\endgroup$– MarcoBCommented May 14, 2020 at 18:03
$\begingroup$
$\endgroup$
4
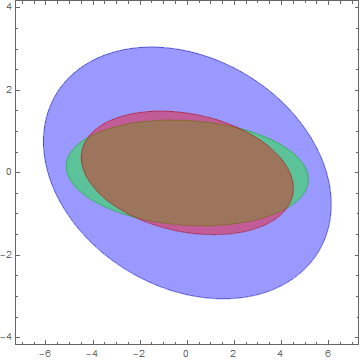
Show @ MapThread[ContourPlot[#, {x, -7, 7}, {y, -4, 4}, Contours -> {#2},
    ContourStyle -> Darker@#3, ContourShading -> {Opacity[.4, #3], None}] &,
   {{x^2 + 4 y^2 + x y, x^2 + 16 y^2 + x y, x^2 + 9 y^2 + 1.5 x y},
    {35, 26, 19},
    {Blue, Green, Red}}]
Alternatively, you can use RegionPlot:
Show @ MapThread[RegionPlot[#, {x, -7, 7}, {y, -4, 4}, PlotStyle -> Opacity[.5, #2],
    BoundaryStyle -> Darker@#2] &,
  {{x^2 + 4 y^2 + x y <= 35,  x^2 + 16 y^2 + x y <= 26, x^2 + 9 y^2 + 1.5 x y <= 19},
  { Blue, Green, Red}}]
-
-
$\begingroup$ The problem is solved. Could you please edit or remove the plot(for copyright issues)? It would be highly appreciated if you do so. Please. $\endgroup$ Commented May 14, 2020 at 17:42
-
1$\begingroup$ @SahabubJahedi You seem to have a strange conception of how this site works. What exactly is your concern? Your Question and the Answers you received do not contain private or confidential data. $\endgroup$ Commented May 15, 2020 at 10:34
-
$\begingroup$ Please try to understand. Actually, I am trying to make some notes. This plot may be there with the same legend name. So. If I try to upload in some specific online portal they may not allow me to upload it. I will be highly obliged if you edit it or remove it. Please, it's a request $\endgroup$ Commented May 15, 2020 at 14:15


