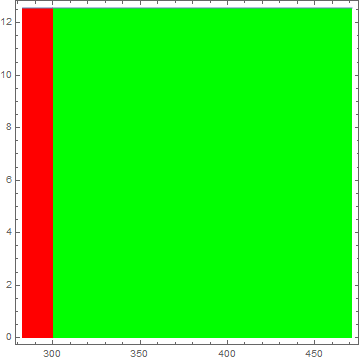
How do I fill left part of x=300 straight line with red colour and right part with green colour?
ContourPlot[x == 300, {x, 90 Pi, 150 Pi}, {y, 0, 4 Pi}]
Try
Show[
  ContourPlot[x==300,{x,90 Pi,150 Pi},{y,0,4 Pi}],
  Plot[4 Pi,{x,90 Pi,300},PlotRange->{0,4 Pi},Filling->Axis,FillingStyle->Red],
  Plot[4 Pi,{x,300,150 Pi},PlotRange->{0,4 Pi},Filling->Axis,FillingStyle->Green]
]

ContourPlot[x, {x, 90 Pi, 150 Pi}, {y, 0, 4 Pi}, Contours -> {300}, ContourShading -> {Red, Green}]$\endgroup$