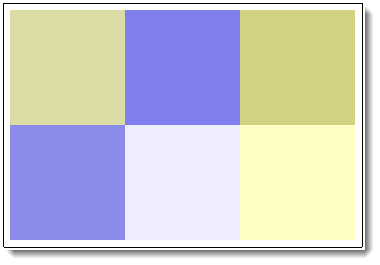
I have two ArrayPlots, and I want to overlap them as it is done here.
For clarity, suppose
Array1 = RandomReal[{0, 1}, {3, 2}];
Array2 = RandomReal[{0, 1}, {3, 2}];
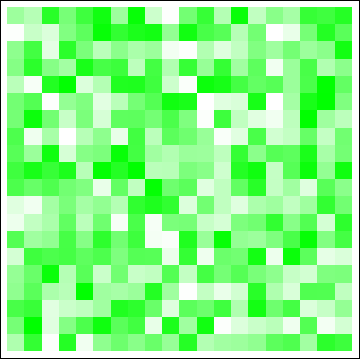
and the first ArrayPlot uses ColorFunction -> (Blend[{White,Yellow},#]&), and the second uses ColorFunction -> (Blend[{White,Blue},#]&).
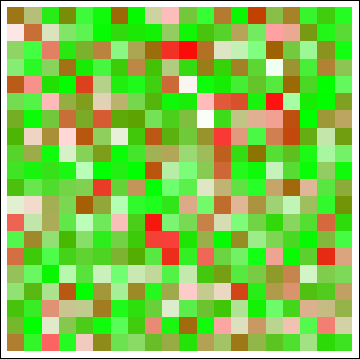
I'd like to combine them in such a way I end up with an ArrayPlot with White, Yellow, Blue and Green shades.
Thanks for your attention.

Array1andArray1are identical, so there is never any partial overlap. For that reason, I can't see why you don't just create a third new array (e.g. the sum) from the two given ones and plot that with the desired color scheme. It would be a much cleaner solution, I think. $\endgroup$A1[[1,1]] = 0.5, A1[[1,2]] = 0, A2[[1,1]] = 0, A2[[1,2]] = 0.5, the sum would be the same, but I'd like the point(1,1)to be a shade of Yellow, while the point(1,2)to be a shade of Blue. $\endgroup$