1
$\begingroup$

I would like to generate ArrayPlot from data below

values = {1534, 1404, 1484, 1564, 1414, 1464, 1534, 1454, 1414, 1444, 
1584, 1534, 1604, 1474, 1554, 1484, 1414, 1484, 1604, 1474, 1484, 
1826, 1856, 1806, 1916, 1826, 1786, 1906, 1846, 584, 724, 544, 644,
1409, 1309, 1659, 1389, 1359, 1389, 2400, 1389, 2400, 2650, 3550, 
3550, 3500, 1409, 1289, 1559, 1409, 1609, 1409, 1339, 1409, 1609, 
2874, 1609, 4000, 4450, 4000, 3770, 4000, 2500, 2650};
mat = Partition[values, 8, 8];

However, only values running from 1000-5000 should be plotted.

colours = Reverse[{Red, Yellow, Green, Cyan, Blue, Magenta}];
z1bound = 1000;
z2bound = 5000;
colourfunc = 
Function[Blend[Reverse[{Red, Yellow, Green, Cyan, Blue, Magenta}], 
Rescale[#, {z1bound, z2bound}]]];

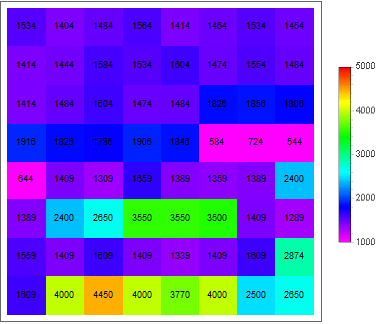
Values outside this interval, such as 584,724,544,644 should be excluded from an ArrayPlot(e.g. plotted in a white colour). I have rescaled my colourfunc in this way but the above-mentioned values are plotted in the ArrayPlotanyway (in a Magenta colour).

arrayplot = 
ArrayPlot[mat, ColorFunction -> colourfunc, 
ColorFunctionScaling -> False, 
PlotLegends -> BarLegend[{colourfunc, {z1bound, z2bound}}], 
Epilog -> {Black, 
MapIndexed[Text[#1, Reverse[#2 - 1/2]] &, Reverse[mat], {2}]}]

ArrayPlot

I will be grateful for any help.

$\endgroup$
3
  • $\begingroup$ Maybe use Clip[mat, {1000, 5000}, {White, White}] $\endgroup$
    – Coolwater
    Commented Nov 12, 2018 at 20:59
  • $\begingroup$ "The barlegend should run from 1000 corresponding to Magenta" and "the lowest value 1289 does not correspond to "lowest" colour in the colourfunction (pink colour)" contradict each other. Which is correct? $\endgroup$
    – Coolwater
    Commented Nov 14, 2018 at 10:55
  • $\begingroup$ @Coolwater, Yes you are right, it contradicts each other. The bar legend should run from 1000(Magenta) to 5000 (Red). I made a mistake in that previous comment. $\endgroup$
    – Moonwalk
    Commented Nov 14, 2018 at 11:29

1 Answer 1

1
$\begingroup$

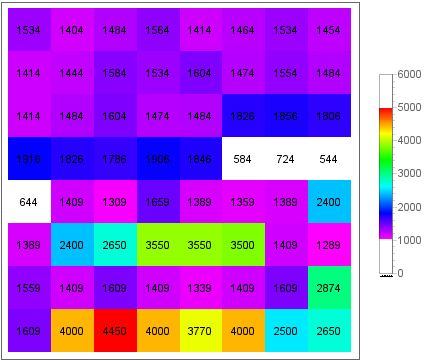
Update:

colourfunc2 = Function[Blend[Reverse[{Red, Yellow, Green, Cyan, Blue, Magenta}], #]]; 
ArrayPlot[mat /. x_ /; (x < 1000 || x > 5000) :> None, 
 ColorFunction -> colourfunc2 , 
 Epilog -> {Black, MapIndexed[Text[#1, Reverse[#2 - 1/2]] &, Reverse[mat], {2}]},
 PlotLegends -> BarLegend[{If[# < 1/6 || # > 5/6 , White, 
      colourfunc2[Rescale[#, {1/6, 5/6} , {0, 1}  ]] ] &, {0, 6000}}]] 

enter image description here


Original answer:

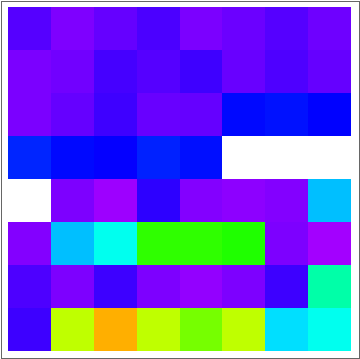
ArrayPlot[mat /. x_ /; (x < 1000 || x > 5000) :> White, 
 ColorFunction -> colourfunc, ColorFunctionScaling -> False]

enter image description here

Alternatively,

ArrayPlot[mat ,
 ColorFunction ->(If[# < 1000||# > 5000, White, colourfunc @ #]&), 
 ColorFunctionScaling -> False] 

same picture

ArrayPlot[mat , ColorRules -> {_?(# < 1000 || # > 5000 &) :> White},
  ColorFunction -> colourfunc, ColorFunctionScaling -> False] 

same picture

Note: You can also use None instead of White to color the selected cells in background color.

$\endgroup$
4
  • $\begingroup$ @Moonwalk, does colourfunc2= Function[Blend[Reverse[{Red, Yellow, Green, Cyan, Blue, Magenta}],#]]; ArrayPlot[mat /. x_ /; (x < 1000 || x > 5000) :>None, ColorFunction -> colourfunc2] give the desired result? $\endgroup$
    – kglr
    Commented Nov 12, 2018 at 21:12
  • $\begingroup$ Thank you @kglr. It is almost perfect. Could you also adjust barlegend in the same way? $\endgroup$
    – Moonwalk
    Commented Nov 12, 2018 at 21:39
  • $\begingroup$ @Moonwalk, please see the update. $\endgroup$
    – kglr
    Commented Nov 12, 2018 at 23:47
  • $\begingroup$ ,it's almost flawless :). The barlegend should run from 1000 corresponding to Magenta colour to 5000 corresponding to Red colour. I tried to adjust the barlegend in this way: BarLegend[{If[# < 1/5, White, colourfunc2[Rescale[#, {1/5, 1}, {0, 1}]]] &, {0, 5000}}, Ticks -> Table[i, {i, 1000, 5000, 500}]]]. However, the colours and corresponding values on barlegend are not in correspondence to ArrayPlot. Notice e.g. value 4450 which in the ArrayPlot is plotted in Red, but in the BarLegend its value corresponds to Yellow/Orange. $\endgroup$
    – Moonwalk
    Commented Nov 13, 2018 at 8:24

Your Answer

By clicking “Post Your Answer”, you agree to our terms of service and acknowledge you have read our privacy policy.

Not the answer you're looking for? Browse other questions tagged or ask your own question.