Working blind.. here is a little trick to let you visualize where ContourPlot evaluates your function and help you find appropriate settings for PlotPoints and MaxRecursion. I think MaxRecursion doesn't help if it doesn't even spot the countour on first pass.
cv = 3/4;
Show[
 MapAt[Graphics[{If[#[[3]] > cv, Red, Blue],
       Point[#[[1 ;; 2]]]} & /@ #[[1]]] &,
  Reap[ContourPlot[  (fv = Sin[x] Cos[y]) == cv ,
      {x, -4, 4}, {y, -4, 4},
    EvaluationMonitor :> Sow[{x, y, fv}],
    MaxRecursion -> 2, PlotPoints -> 5]], {2}]]
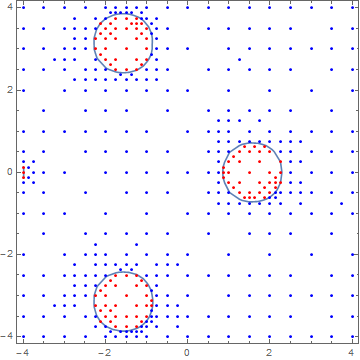
Applying this to your example,
cv = 100;
Show[
 MapAt[Graphics[{If[#[[3]] > cv, Red, Blue],
       Point[#[[1 ;; 2]]]} & /@ #[[1]]] &,
  Reap[ContourPlot[
    fv = 0.000157223 10^(2 x - 2 y), {x, -6, -1}, {y, -6, -1},
    Contours -> {1, 10, 100, 1000},
    EvaluationMonitor :> Sow[{x, y, fv}],
    ContourShading -> None]], {2}]]
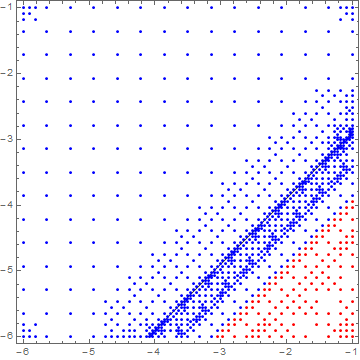
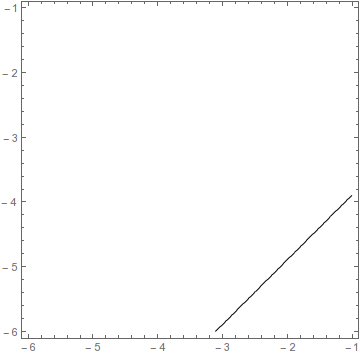
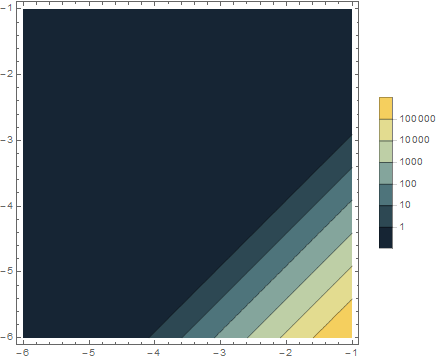
you see it is finding the contours just fine so it seems like a glitch in contourshading. (I tried playing with ContourStyle with no success )
As noted by @Rahul in comments this works:
ContourPlot[ 0.000157223 10^(2 x - 2 y) == {1, 10, 100,  1000},
  {x, -6, -1}, {y, -6, -1}]
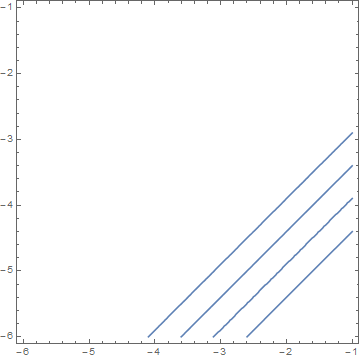

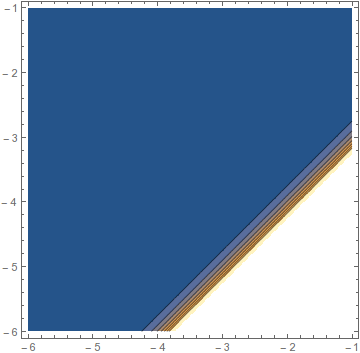


flooks like? :-) $\endgroup$PlotPoints$\endgroup$ContourPlot[0.000157223 10^(2 x - 2 y) == 100, {x, -6, -1}, {y, -6, -1}]does plot the contour. $\endgroup$