1
$\begingroup$

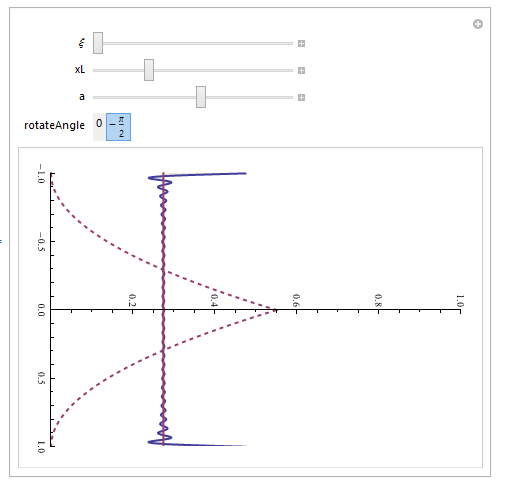
My question is on trying to cut off certain plots within a Plot with multiple expressions being plotted. I want to be able to stop the two dashed-line plots at their point of intersection, without affecting how the other two plots are rendered. Please see the image below:
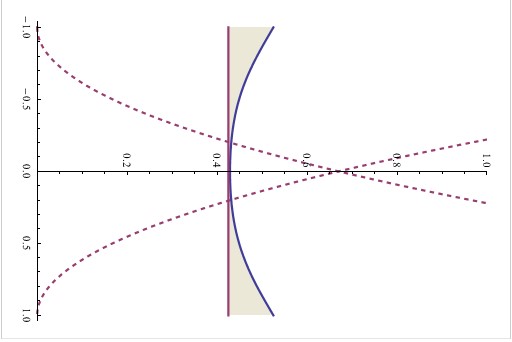
Example Plot

Is there a way to limit the plotting range to a certain value for some of the expressions, but not the others? Again, I want the two dashed lines to stop plotting at the point where they intersect. This image shows 4 different plots: two quadratic functions that are offset by 1 and -1, a straight line, and a parabolic function.

EDIT: Code included:

\[Lambda]1 = N[Table[(2 m - 1)/2*\[Pi], {m, 1, Nterms}]];
\[Theta][1][\[Eta]_, \[Xi]_, Nterms_] := 1 - 2 \!\(
\*UnderoverscriptBox[\(\[Sum]\), \(m = 1\), \(Nterms\)]\(
\*FractionBox[
SuperscriptBox[\((\(-1\))\), \(m + 
       1\)], \(\[Lambda]1[\([\)\(m\)\(]\)]\)] Cos[\ \[Lambda]1[\([\)\
\(m\)\(]\)]*\[Eta]]*Exp[\(-4\)*
\*SuperscriptBox[\(\[Lambda]1[\([\)\(m\)\(]\)]\), \(2\)]\ \[Xi]]\)\)

Manipulate[
 Rotate[
  Plot[
   {
    a (η - 1)^2,
    a (η + 1)^2,
    xL + 0.2*θ[1][η, ξ, Nterms],
    xL
    },
   {η, -1, 1},

   PlotRange -> {0, 1},
   Filling -> {3 -> xL},
   PlotStyle ->
    {
     {Thick, Dashed, ColorData[1, 2]},
     {Thick, Dashed, ColorData[1, 2]},
     {Thick, ColorData[1, 1]},
     {Thick, ColorData[1, 2]}
    },
   AspectRatio -> 1.5
   ]
  , rotateAngle],

 {ξ, 0, 0.1},
 {xL, 0, 1},
 {{a, 1}, 0, 1},
 {{rotateAngle, -Pi/2}, {0, -Pi/2}}
 ]

EDIT: A solution with Show and 3 Plots, but I would prefer a more elegant way to do this inside of one Plot command:

Manipulate[
 Rotate[Show[
   Plot[{a (\[Eta] - 1)^2}, {\[Eta], 0, 1},
    PlotRange -> {{-1, 1}, {0, 1}}, 
    PlotStyle -> {Thick, Dashed, ColorData[1, 2]}, AspectRatio -> 1.5],

   Plot[{a (\[Eta] + 1)^2}, {\[Eta], -1, 0},
    PlotRange -> {{-1, 1}, {0, 1}}, 
    PlotStyle -> {Thick, Dashed, ColorData[1, 2]}, AspectRatio -> 1.5],

   Plot[
    {xL + 0.2*\[Theta][1][\[Eta], \[Xi], Nterms], xL}, {\[Eta], -1, 1},
    PlotRange -> {0, 1}, Filling -> {1 -> xL}, 
    PlotStyle -> {{Thick, ColorData[1, 1]}, {Thick, ColorData[1, 2]}},
    AspectRatio -> 1.5]
   ], rotateAngle],

 {\[Xi], 0, 0.1},
 {xL, 0, 1},
 {{a, 1}, 0, 1},
 {{rotateAngle, -Pi/2}, {0, -Pi/2}}
 ]
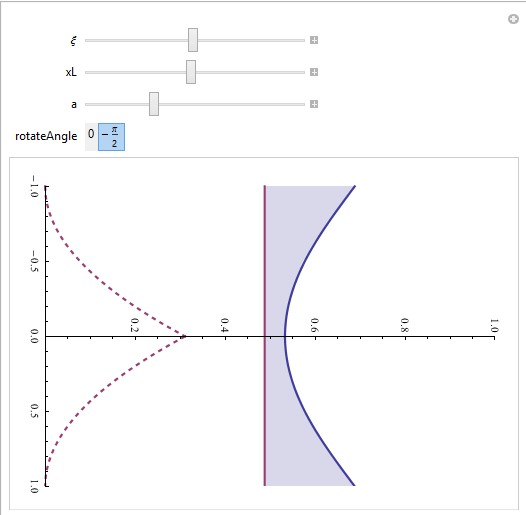
Imgur

$\endgroup$
5
  • $\begingroup$ xL + 0.2*\[Theta][1][\[Eta], \[Xi], Nterms], is missing. $\endgroup$
    – Öskå
    Commented May 15, 2014 at 16:11
  • $\begingroup$ They are pretty complex orthogonal series expansion functions, so I excluded them~ Nterms is just the number of terms the summation carries out to. I'll add it in, one sec $\endgroup$
    – madacho
    Commented May 15, 2014 at 16:13
  • $\begingroup$ Well, it doesn't matter for the "cutting plot" issue anyway :) $\endgroup$
    – Öskå
    Commented May 15, 2014 at 16:14
  • $\begingroup$ Any value for Nterms..? $\endgroup$
    – Öskå
    Commented May 15, 2014 at 16:21
  • $\begingroup$ Set to 30 at the moment $\endgroup$
    – madacho
    Commented May 15, 2014 at 16:23

2 Answers 2

2
$\begingroup$

Update: Combining all plots in a single one and using ConditionalExpression to control the pieces to draw:

 Manipulate[
 Rotate[Plot[{ConditionalExpression[a (\[Eta] - 1)^2, 0 < \[Eta] <= 1],
    ConditionalExpression[a (\[Eta] + 1)^2, -1 < \[Eta] <= 0],
    xL + 0.2*\[Theta][2][\[Eta], \[Xi], Nterms],
     xL},
   {\[Eta], -1, 1}, PlotRange -> {{-1, 1}, {0, 1}}, 
   Filling -> {3 -> xL}, 
   PlotStyle -> {Directive[Thick, Dashed, ColorData[1, 2]],
                 Directive[Thick, Dashed, ColorData[1, 2]],
                 Directive[Thick, ColorData[1, 1]],
                 Directive[Thick, ColorData[1, 2]]}, AspectRatio -> 1.5], 
 rotateAngle],
 {\[Xi], 0, 0.1}, {xL, 0, 1}, {{a, 1}, 0,1}, {{rotateAngle, -Pi/2}, {0, -Pi/2}}]

enter image description here


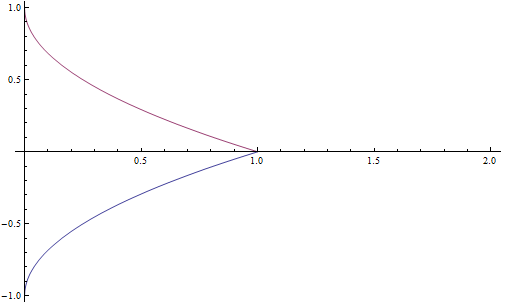
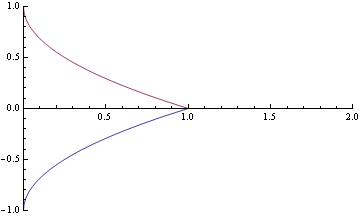
Another way is to use the option RegionFunction:

y1[x_] := Sqrt@x - 1
y2[x_] := -Sqrt@x + 1
Plot[{y1[x], y2[x]}, {x, 0, 2}, RegionFunction -> Function[{x, y}, y1[x] < y2[x]]] 

enter image description here

The settings RegionFunction -> (y1[#] < y[#] &) and RegionFunction -> (# < 1 &) will also work.

$\endgroup$
4
  • $\begingroup$ kguler, I'm not sure how this works: are you basically setting a function that is making a region where the Plots will be cut off at? What will happen if there are additional plots inside, will they be cutoff at the intersection point as well? $\endgroup$
    – madacho
    Commented May 15, 2014 at 16:31
  • $\begingroup$ @madacho correct.. see RegionFunction. $\endgroup$
    – kglr
    Commented May 15, 2014 at 16:34
  • $\begingroup$ Awesome! Thanks so much, that works perfectly, kudos! $\endgroup$
    – madacho
    Commented May 15, 2014 at 17:42
  • $\begingroup$ @madacho, glad it was useful. Thank you for the accept. $\endgroup$
    – kglr
    Commented May 15, 2014 at 18:26
2
$\begingroup$
y1[x_] := Sqrt@x - 1
y2[x_] := -Sqrt@ x + 1
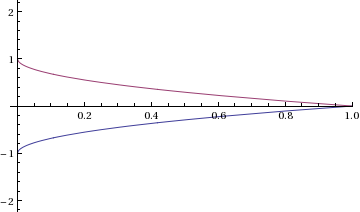
Plot[{y1[x], y2[x]}, {x, 0, x /. Last@Solve[y1[x] == y2[x]]}, PlotRange->{{0, 2}, {-1, 1}}]

Mathematica graphics

or you can play with PlotRange:

Plot[{y1[x], y2[x]}, {x, 0, 10}, 
  PlotRange -> {{0, x /. Last@Solve[y1[x] == y2[x]]}, {-1, 1}}]

Mathematica graphics

$\endgroup$
5
  • $\begingroup$ May I edit with my solution..? :) $\endgroup$
    – Öskå
    Commented May 15, 2014 at 16:03
  • $\begingroup$ @Öskå Be my guest :=) $\endgroup$ Commented May 15, 2014 at 16:04
  • $\begingroup$ I figured out a way to do it with Show and 3 Plots, one for each of the quadratic functions (dashed lines), and the third that combines the other 2 functions. However, the idea was to be able to do this all in one Plot command. Thanks for the solutions Oska and belisarius, I'm going to try them out to see if they'll work for me now! $\endgroup$
    – madacho
    Commented May 15, 2014 at 16:12
  • $\begingroup$ I want to be able to adjust the location of the intersection point, while having the plots stop after that point, if that clears things up a bit more. I have a Slider for the coefficient "a" that does this inside of the Manipulate. $\endgroup$
    – madacho
    Commented May 15, 2014 at 16:16
  • $\begingroup$ Yes, I was just wondering if there was a way to specify domains for specific functions inside of one Plot command. The Show and Plot combination works how I want it to, just looks a bit inefficient with three Plots where one could do nicely. $\endgroup$
    – madacho
    Commented May 15, 2014 at 16:19

Your Answer

By clicking “Post Your Answer”, you agree to our terms of service and acknowledge you have read our privacy policy.

Not the answer you're looking for? Browse other questions tagged or ask your own question.