10
$\begingroup$

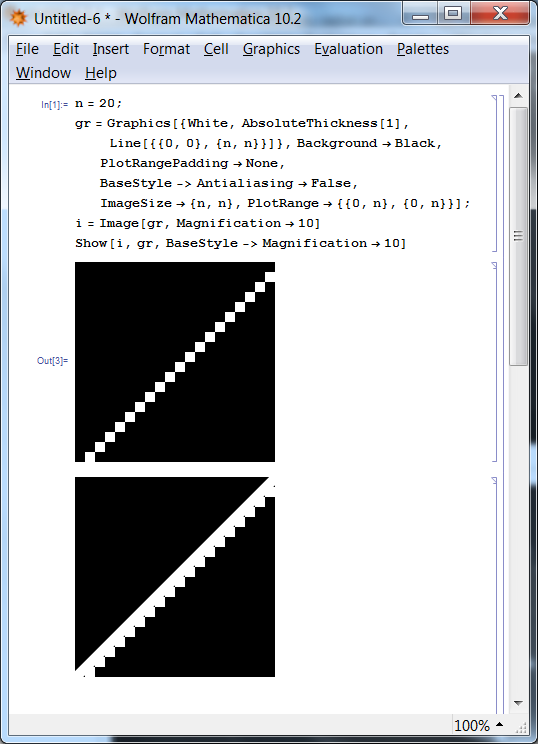
I plot a straight diagonal line and then simply rasterize it. Consider what happens (Mathematica 8.0.4, 10.2, 11.1.1 and 12.0 on Windows 7 x64):

n = 20;
gr = Graphics[{White, AbsoluteThickness[1], Line[{{0, 0}, {n, n}}]}, Background -> Black, 
   PlotRangePadding -> None, BaseStyle -> Antialiasing -> False, ImageSize -> {n, n}, 
   PlotRange -> {{0, n}, {0, n}}];
i = Image[gr, Magnification -> 10]
Show[i, gr, BaseStyle -> Magnification -> 10]

screenshot

As it is clearly seen, the diagonal white Line is converted to under-diagonal line by Rasterize. Is it a bug or I misunderstand something?

$\endgroup$
3
  • $\begingroup$ It seems to me that you override the BaseStyle -> Antialiasing -> False setting when you use Show, and this causes problems. $\endgroup$
    – shrx
    Commented Oct 3, 2015 at 11:30
  • $\begingroup$ @shrx With Show[i, gr, BaseStyle -> {Magnification -> 10, Antialiasing -> False}] and Magnify[Show[i, gr], 10] I get the same problem with additional bug: empty white space after the the output. $\endgroup$ Commented Oct 3, 2015 at 11:34
  • 2
    $\begingroup$ There are many alignment problems like this, unfortunately. $\endgroup$
    – Szabolcs
    Commented Oct 3, 2015 at 11:37

1 Answer 1

6
$\begingroup$

A bit of investigation.

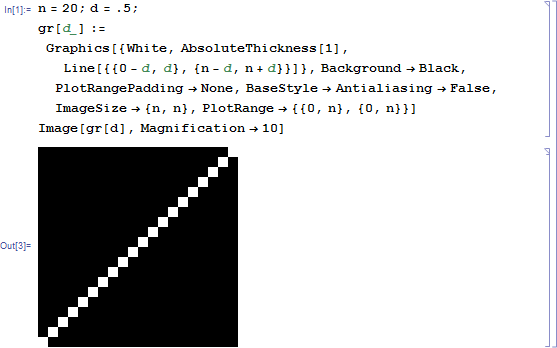
The first what come to mind is that the described bug is a result of incorrect conversion between the coordinates in Graphics and the pixel positions in Image. Typically they are shifted by 1/2 relative to each other, the latter having vertical positions counted from the top to the bottom.

Checking:

n = 20; d = .5;
gr[d_] := Graphics[{White, AbsoluteThickness[1], Line[{{0 - d, d}, {n - d, n + d}}]}, 
   Background -> Black, PlotRangePadding -> None, BaseStyle -> Antialiasing -> False, 
   ImageSize -> {n, n}, PlotRange -> {{0, n}, {0, n}}];
i = Image[gr[d], Magnification -> 10]

screenshot

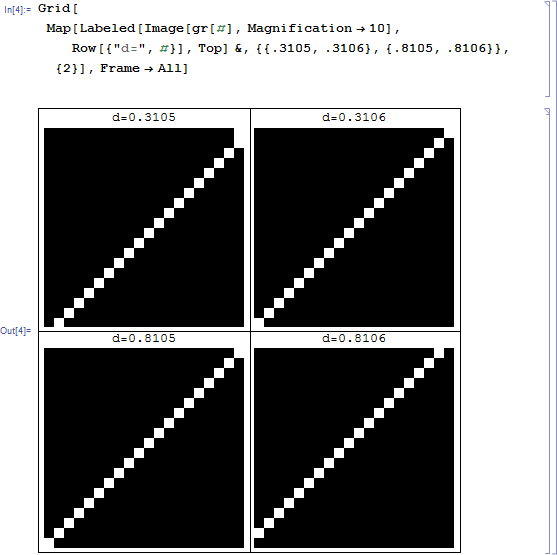
Works! But what if we use another value for d? Experimenting shows that we get the same picture for d from .3106 to .8105 inclusively! But already for d = .3105 and d = .8106 the picture is different:

Grid[Map[Labeled[Image[gr[#], Magnification -> 10], Row[{"d=", #}], 
    Top] &, {{.3105, .3106}, {.8105, .8106}}, {2}], Frame -> All]

screenshot

What a strange threshold! Apparently Rasterize does not use the Bresenham's line algorithm.

$\endgroup$

Your Answer

By clicking “Post Your Answer”, you agree to our terms of service and acknowledge you have read our privacy policy.

Not the answer you're looking for? Browse other questions tagged or ask your own question.