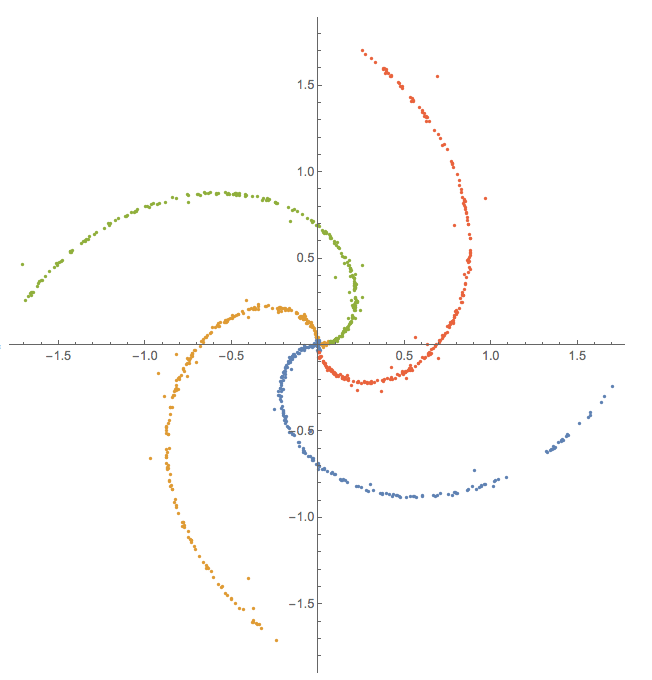
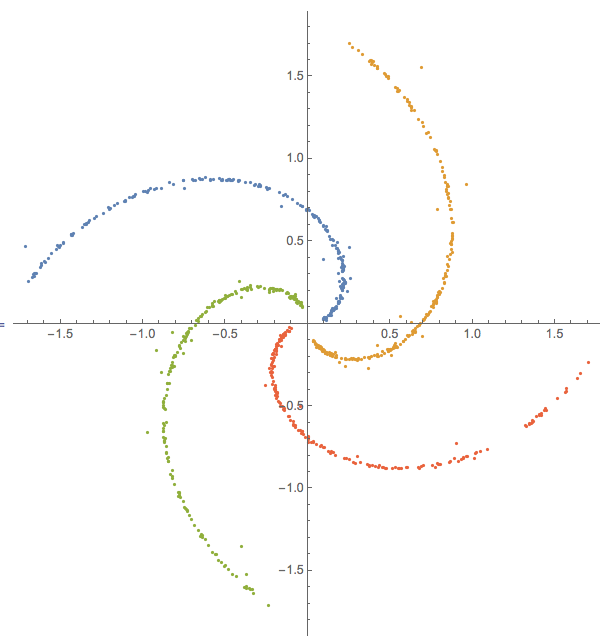
Here is one solution.
- Find a small number of nearest neighbors (NN's) for each point.
- Make a graph each node of which corresponds to a data point and each edge corresponds to a NN's pair.
- Partition the graph into connected components, or communities, or cliques.
In order the last step to work well, it might be a good idea to remove the points in the center of the data of the question.
The question says the desired partition is for "two special parts," but I see four "special" parts in the plot. That is why my solution explanations show four parts. The solution also works if two parts are desired.
Here are the Mathematica commands.
Finding the NN's
nf = Nearest[data];

pointToIndexRules = Dispatch[Thread[data -> Range[Length[data]]]];

numberOfNNs = 20;
dataNNs = Map[{#, Complement[nf[#, numberOfNNs], #]} &, data];
Making the graph edges (pairs of connected nodes)
graphPairs =
Flatten@Map[
 Function[{p}, # <-> p & /@ Complement[nf[p, numberOfNNs], p]],
 data] /. pointToIndexRules;
Optionally remove points at the center
indsToRemove = Select[data, #.# < 0.01 &] /. pointToIndexRules;

graphPairs=Select[graphPairs,!(MemberQ[indsToRemove,#[[1]]] ||             MemberQ[indsToRemove,#[[2]]])&];
Make the graph object
dataGraph = Graph[graphPairs];
Find partition of the graph and the data
clsInds = FindGraphPartition[dataGraph, 4];

cls = Map[data[[#]] &, clsInds];
Plot the clusters
ListPlot[cls, AspectRatio -> Automatic]
Here is the result of step 6.

If the center points are removed (which I think is a more robust method) then it is better in step 5 to use
clsInds = KCoreComponents[dataGraph, 3]
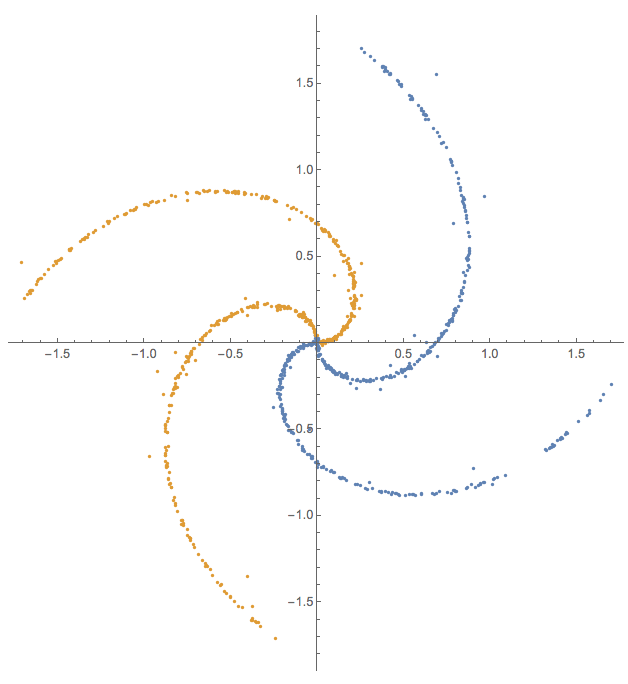
Here is the result using that option:

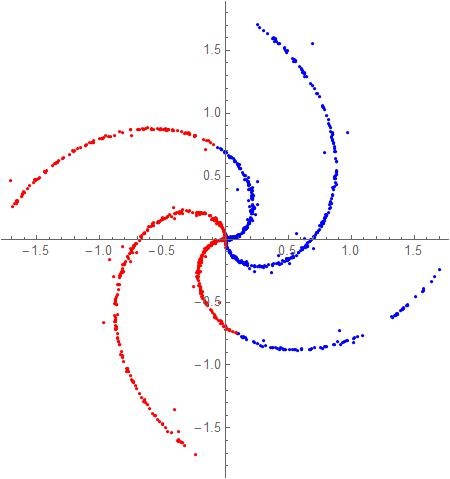
If we want to see the data as being made of two parts then in step 5 we can use
clsInds = FindGraphPartition[dataGraph, 2];
and what we get is this result:


