I am having trouble getting FindClusters to find the right clustering for this set of data (and many other sets of data similar to it):
mydata=  {{0.0393548, 518600.}, {0.0878788, 338.}, {0.113012, 4479.63},
         {0.120947, 7030.38}, {0.121241, 2112.75}, {0.12131, 3114.},
         {0.128903, 3528.63}, {0.151097, 2857.25}, {0.154496, 5622.75},
         {0.167173, 1662.88}, {0.167782, 4528.25}, {0.52439, 85.875},
         {0.771838, 776.875}, {0.989017, 1857.63}, {1., 629.875},
         {1., 147.125}, {1., 523.5}, {1., 51.75},  {1., 33.},
         {1., 571.125}, {1., 899.75}, {1., 1196.38},{1., 3080.}}
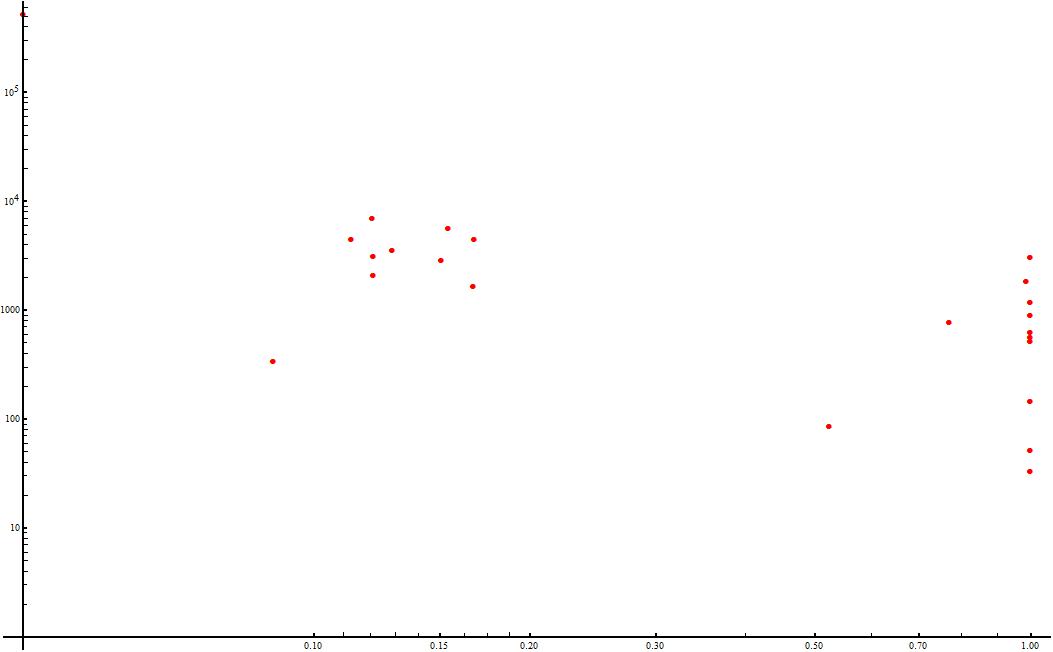
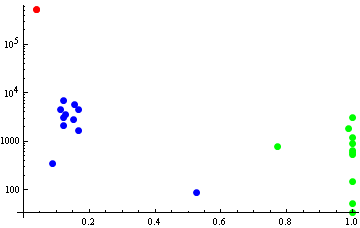
By eye, when this data is plotted with ListLogLogPlot, there are three reasonably clear clusters, with one cluster being the single point in the upper-left part of the plot on the y-axis (sorry it's hard to see):

However, I can't seem to get FindClusters to find the right groupings even when I tell it there are three clusters (it also fails when I try to get the clustering without any specified number of clusters) :
Length /@ FindClusters[myData, 3]

{3, 14, 6}  (* correct output would be {1, 10, 12} *)
I've tried some renormalizations and log transformations of the data but I still can't get the correct groupings using FindClusters. Any suggestions for how to get this right?

