13
$\begingroup$

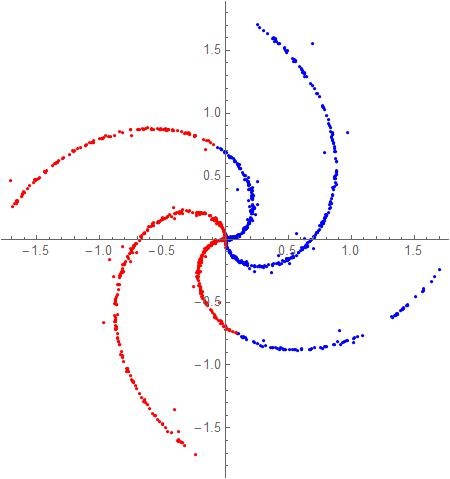
I am trying to use FindClusters to segment data points into two special parts

data

ListPlot[data, PlotRange -> All, AspectRatio -> Automatic]

It is clear that these points can be divided into two parts, each radial arm can be treated as one part. I've tried different DistanceFunctions but can not get what I want, and I don't know how to define a right distance functions.

Show[
  ListPlot[FindClusters[data, 2, DistanceFunction -> CosineDistance][[1]],  
    AspectRatio -> Automatic, PlotStyle -> Blue],
  ListPlot[FindClusters[data, 2, DistanceFunction -> CosineDistance][[2]], 
    AspectRatio -> Automatic, PlotStyle -> Red], 
  PlotRange -> All]    

enter image description here

Is there any way to solve this problem?

$\endgroup$
3
  • $\begingroup$ Welcome to Mathematica.SE! I hope you will become a regular contributor. To get started, 1) take the introductory tour now, 2) when you see good questions and answers, vote them up by clicking the gray triangles, because the credibility of the system is based on the reputation gained by users sharing their knowledge, 3) remember to accept the answer, if any, that solves your problem, by clicking the checkmark sign, and 4) give help too, by answering questions in your areas of expertise. $\endgroup$
    – bbgodfrey
    Commented Sep 19, 2015 at 14:36
  • 1
    $\begingroup$ A figure is missing, or the reference to it needs to be deleted. $\endgroup$
    – bbgodfrey
    Commented Sep 19, 2015 at 14:39
  • $\begingroup$ A simpler code to plot the clusters of the data is to use: ( cls = FindClusters[data, 2, DistanceFunction -> CosineDistance]; ListPlot[cls] ) $\endgroup$ Commented Sep 19, 2015 at 17:10

1 Answer 1

14
$\begingroup$

Here is one solution.

  1. Find a small number of nearest neighbors (NN's) for each point.
  2. Make a graph each node of which corresponds to a data point and each edge corresponds to a NN's pair.
  3. Partition the graph into connected components, or communities, or cliques.

In order the last step to work well, it might be a good idea to remove the points in the center of the data of the question.

The question says the desired partition is for "two special parts," but I see four "special" parts in the plot. That is why my solution explanations show four parts. The solution also works if two parts are desired.

Here are the Mathematica commands.

  1. Finding the NN's

    nf = Nearest[data];
    
    pointToIndexRules = Dispatch[Thread[data -> Range[Length[data]]]];
    
    numberOfNNs = 20;
    dataNNs = Map[{#, Complement[nf[#, numberOfNNs], #]} &, data];
    
  2. Making the graph edges (pairs of connected nodes)

    graphPairs = 
    Flatten@Map[
     Function[{p}, # <-> p & /@ Complement[nf[p, numberOfNNs], p]], 
     data] /. pointToIndexRules;
    
  3. Optionally remove points at the center

    indsToRemove = Select[data, #.# < 0.01 &] /. pointToIndexRules;
    
    graphPairs=Select[graphPairs,!(MemberQ[indsToRemove,#[[1]]] ||             MemberQ[indsToRemove,#[[2]]])&];
    
  4. Make the graph object

    dataGraph = Graph[graphPairs];
    
  5. Find partition of the graph and the data

    clsInds = FindGraphPartition[dataGraph, 4];
    
    cls = Map[data[[#]] &, clsInds];
    
  6. Plot the clusters

    ListPlot[cls, AspectRatio -> Automatic]
    

Here is the result of step 6.
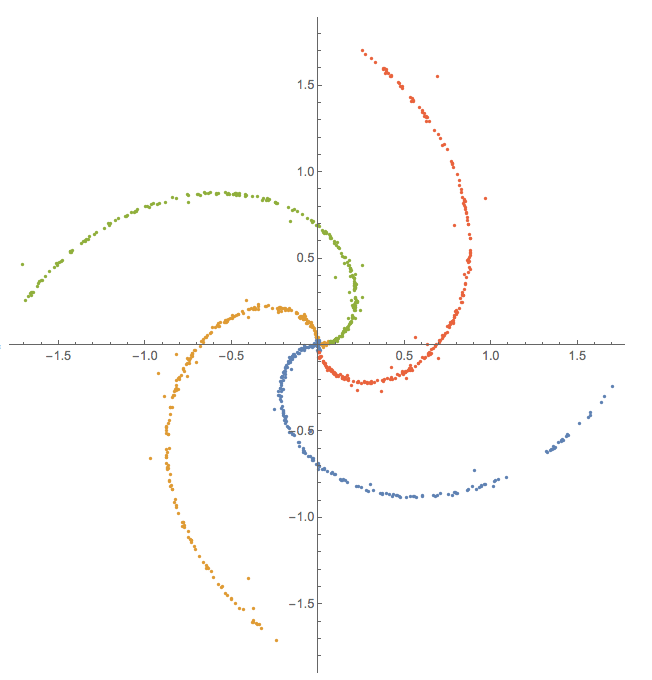
enter image description here

If the center points are removed (which I think is a more robust method) then it is better in step 5 to use

clsInds = KCoreComponents[dataGraph, 3] 

Here is the result using that option:
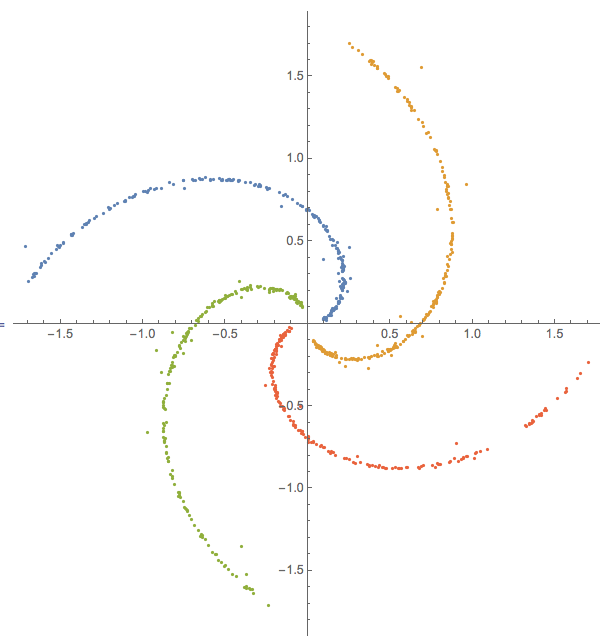
enter image description here

If we want to see the data as being made of two parts then in step 5 we can use

clsInds = FindGraphPartition[dataGraph, 2];

and what we get is this result:
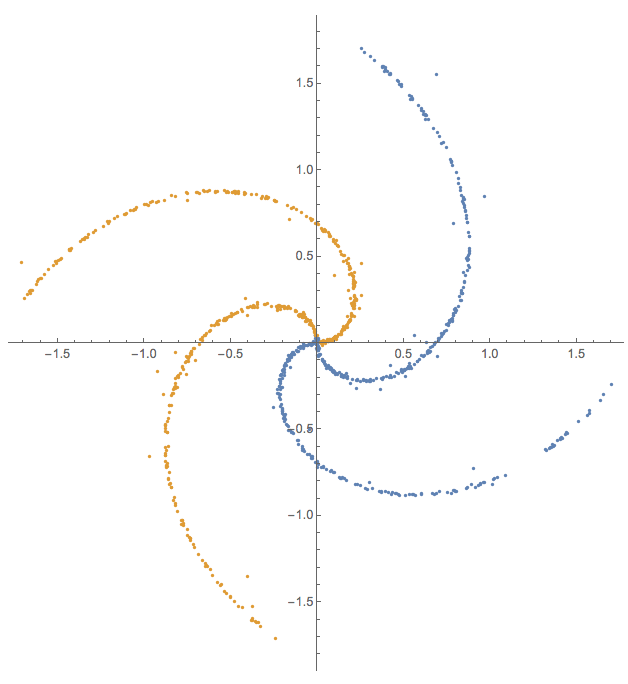
enter image description here

$\endgroup$

Your Answer

By clicking “Post Your Answer”, you agree to our terms of service and acknowledge you have read our privacy policy.

Not the answer you're looking for? Browse other questions tagged or ask your own question.