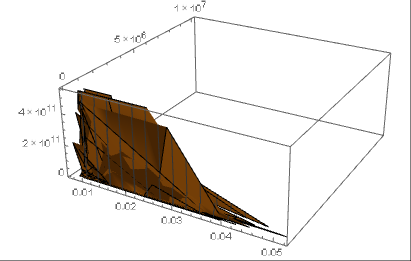
There seem to be a few problems, first, country data returns Quantities, so strip those off.
cDat = (QuantityMagnitude /@ {CountryData[#1, "BirthRateFraction"],
     CountryData[#1, "AnnualDeaths"], CountryData[#1, "GDP"]} &) /@
 CountryData["Countries"];
Then you need to get rid of all the Missing[NotAvailable] entries.
cDat = Cases[cDat, {x_Real,y_Real,z_Real}:>{x,y,z}];
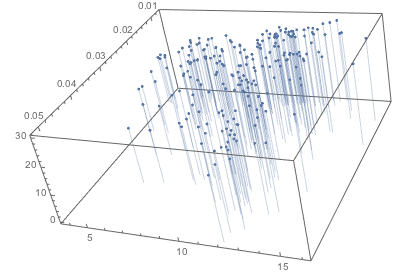
There also seem to be pretty large ranges in the last two elements, so I plotted those two on a log scale. I also think a ListPointPlot3D looks nicer with this data, but you can change that.
ListPointPlot3D[{#1,Log@#2,Log@#3}&@@@cDat,Filling->Axis]
Which gives:

EDIT
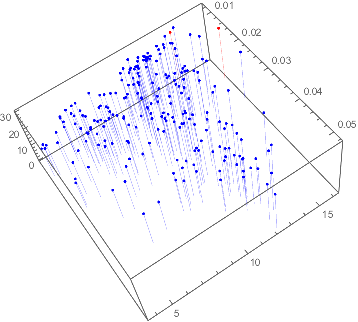
Color by country:
In order to color by country, you need to keep track of the country as well. There are almost certainly more robust ways of doing this, but since this request was in addition to the original question, I'll hack it into the answer as written.
Change how you define cDat
cDat = ({
      QuantityMagnitude@CountryData[#1, "BirthRateFraction"],
      QuantityMagnitude@CountryData[#1, "AnnualDeaths"],
      QuantityMagnitude@CountryData[#1, "GDP"],
      Last@#1
      } &) /@ CountryData["Countries"];

cDat = Cases[
   cDat, {x_Real, y_Real, z_Real, country_} :> {x, y, z, country}];
Then plot it, creating a list for the plot style with a red in place of the country you want to be red, which I've given in a list, so you can select more than one red country,
redCountries = {"Germany", "China"};
ListPointPlot3D[
 List /@ (
   {#1, Log@#2, Log@#3} & @@@ cDat
   )
 , Filling -> Axis
 ,PlotStyle -> (Last /@ cDat) /. {Alternatives @@ redCountries :> Red, _String :> Blue}
 ]


PlotRange -> Allas aLisplot3Doption $\endgroup$