10
$\begingroup$

Much in the fashion of a few problems already answered on Mathematica.SE (1, 2), I am trying to solve the Laplace equation in velocity potential $\phi$ to simulate irrotational, inviscid flow over a cylinder (in Cartesian coordinates).

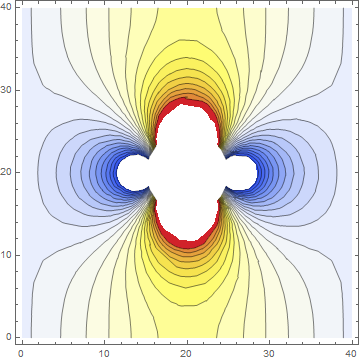
I find that my pressure field is flipped. i.e., at the front ($\theta$=0) the stagnation pressure must be a maximum while it is zero at the top and bottm ($\theta=\pi/2$ and $\theta=3\pi/2$). However, my stagnation pressure is maximum at the top and minimum in the front and back.

The Bernoulli equation was used to calculate the pressure field as follows: $$\frac{P_\text{stag}}{\rho g} = \frac{P_1}{\rho g} + \frac{\vec{V}_1^2}{2 g}$$ $$\vec{V}_1 = \frac{\partial \phi}{\partial y} + \frac{\partial \phi}{\partial x}$$ and $$\vec{V}_1^2 = \left(\frac{\partial \phi}{\partial y}\right)^2 + \left(\frac{\partial \phi}{\partial x}\right)^2$$

My code

Needs["DifferentialEquations`InterpolatingFunctionAnatomy`"]
Needs["NDSolve`FEM`"]

Lx = 40; Ly = 40; lx = 2; ly = 2; cx = Lx/2; cy = Ly/2; r = 5;
Ω = 
  RegionDifference[Rectangle[{0, 0}, {Lx, Ly}], Disk[{cx, cy}, r]];
RegionPlot[Ω]


cellmeasure = 1; iorder = 2;
sol = NDSolveValue[{Laplacian[u[x, y], {x, y}] == 
    NeumannValue[1., x == 0] + NeumannValue[-1, x == Lx], 
   DirichletCondition[u[0, 0] == 0, x == Lx && y == 0]}, 
  u, {x, y} ∈ Ω, 
  Method -> {"PDEDiscretization" -> {"FiniteElement", 
      "MeshOptions" -> {"MaxCellMeasure" -> cellmeasure}, 
      "IntegrationOrder" -> iorder}}]
{cylmesh} = InterpolatingFunctionCoordinates[sol];
cylmesh["Wireframe"]

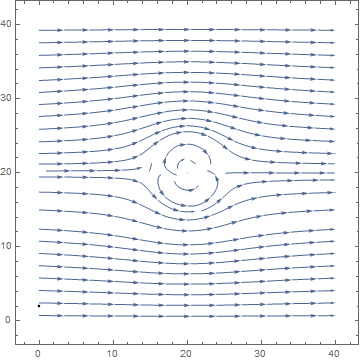
Velocity vectors seem fine

ClearAll[f];
f[x_, y_] := Evaluate[Grad[sol[x, y], {x, y}, "Cartesian"]]
StreamPlot[f[x, y], {x, 0, Lx}, {y, 0, Ly}, AspectRatio -> Automatic, 
 Frame -> True, 
 Epilog -> {Thickness[0.005], Line[{{0, lx}, {0, ly}}]}, 
 StreamPoints -> 50]

enter image description here

Pressure contours are INCORRECT

ClearAll[p];
P∞ = 0;
(*U∞= Evaluate[D[sol[x,y],y] + D[sol[x,y],x]];*)
ρ = 1; (*Air at 25 degree C*)
(*p=P∞+0.5ρ Evaluate[D[sol[x,y],y]^2 + \
D[sol[x,y],x]^2];*)
p = P∞ + 0.5 ρ Evaluate[Norm[f[x, y], 2]];
pplot = ContourPlot[p, {x, y} ∈ Ω, 
  PlotLegends -> Automatic, Mesh -> True, 
  ColorFunction -> "Temperature", Contours -> 25]

enter image description here

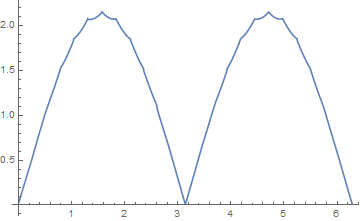
Velocity field around the cylinder is INCORRECT (non zero value at $\theta=0$)

enter image description here

I can only surmise that my "syntax" or manner of usage of some function is incorrect (assuming that the Bernoulli equation has been utilized correctly). What went wrong?

$\endgroup$
4
  • $\begingroup$ How should we interpret the code you commented out in the pressure contours? $\endgroup$
    – MarcoB
    Commented Jul 28, 2015 at 20:15
  • $\begingroup$ @marcob yikes my mistake. The code I commented out may be treated as "old version". Sorry about that. $\endgroup$
    – dearN
    Commented Jul 28, 2015 at 21:37
  • $\begingroup$ No problem. You might still want to edit it out of the question though, for the sake of clarity. $\endgroup$
    – MarcoB
    Commented Jul 28, 2015 at 21:38
  • $\begingroup$ A side question: Do you really mean to modify the IntegrationOrder? I think what you want is modify the MeshOrder. If that is the case, would you mind fixing this in your post. I see more and more people use IntegrationOrder When the mean MeshOrder. $\endgroup$
    – user21
    Commented Jul 29, 2015 at 6:54

1 Answer 1

9
$\begingroup$

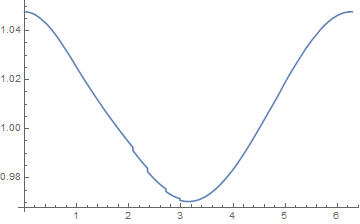
How are you calculating the velocity around the cylinder I am using

 Plot[Norm[f[20 + 5 Cos[\[Theta]], 20 + 5 Sin[ \[Theta]]]], {\[Theta], 
  0, 2 \[Pi]}]

to give

Mathematica graphics

Which I think is correct.

For the pressure we need the correct form for Bernoulli.

Mathematica graphics

Where you take the values of pressure at infinity as 0 but ignore the velocity at infinity. I am also unsure about your use of Norm. A dot product would do. Putting this into your solution gives

ClearAll[p];
P\[Infinity] = 0;
(*U\[Infinity]=Evaluate[D[sol[x,y],y]+D[sol[x,y],x]];*)
\[Rho] = 1;(*Air at 25 degree C*)(*p=P\[Infinity]+0.5\[Rho] \
Evaluate[D[sol[x,y],y]^2+D[sol[x,y],x]^2];*)
p[x_, y_] := 
 P\[Infinity] + 0.5 \[Rho] 1 - 0.5 \[Rho] Evaluate[f[x, y].f[x, y]];
pplot = ContourPlot[p[x, y], {x, y} \[Element] \[CapitalOmega], 
  PlotLegends -> Automatic, Mesh -> True, PlotRange -> All, 
  ColorFunction -> "Temperature", 
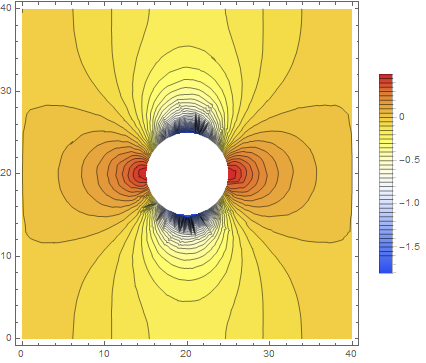
  Contours -> Table[h, {h, -1.6, 0.6, 0.05}]]

Mathematica graphics

So the pressure is approximately 0.5 at the stagnation point and -1.5 at the top and bottom. Hope that helps.

$\endgroup$
3
  • $\begingroup$ Is there some way I could choose the range of data represented by the PlotLegend? Thank you for your answer; I'll try this very soon. $\endgroup$
    – dearN
    Commented Jul 29, 2015 at 11:35
  • $\begingroup$ @drN Have you tried? The answer helped? $\endgroup$
    – JPeter
    Commented Oct 1, 2016 at 10:24
  • $\begingroup$ @JPeter It did, thank you. Apologies for the significant delay. $\endgroup$
    – dearN
    Commented Oct 1, 2016 at 13:23

Your Answer

By clicking “Post Your Answer”, you agree to our terms of service and acknowledge you have read our privacy policy.

Not the answer you're looking for? Browse other questions tagged or ask your own question.