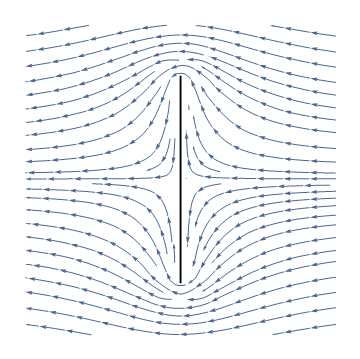
I am trying to calculate a potential flow past a thick plate. The finite element calculation seems to go well but I am finding it difficult to get a nice plot of the flow. The stages below are, defining a boundary mesh and then a full mesh. Next I solve Laplace equation n the region and define a function that calculates the velocity from the gradient of the potential function. I then use StreamPlot to look at the flow field. The flow field is not very nice (not enough stream lines around the plate), so I try put in some StreamPoints to give the field I would like. However this is worse. I also attempt to make a detailed plot around the edge of the plate. This is also a mess. How can I get a nice StreamPlot? Is the problem because there is a hole in the region?
Thanks
Needs["NDSolve`FEM`"]
a = 12; b = 12; L = 1; t = 0.05;
bm = ToBoundaryMesh[
        "Coordinates" -> {{-a, -b}, {a, -b}, {a, b}, {-a,
  b}, {-t, -L}, {t, -L}, {t, L}, {-t, L}},
 "BoundaryElements" -> {LineElement[{{1, 2}, {2, 3}, {3, 4}, {4,
    1}}], LineElement[{{5, 6}, {6, 7}, {7, 8}, {8, 5}}]}];
mesh = ToElementMesh[bm,
"BoundaryMeshGenerator" -> {"Continuation"},
"RegionHoles" -> {{0, 0}},
 MaxCellMeasure -> 0.05,
 "MaxBoundaryCellMeasure" -> 0.05];
  sol = NDSolveValue[{Laplacian[u[x, y], {x, y}] ==
   NeumannValue[-1., x == -a] + NeumannValue[1, x == a],
  DirichletCondition[u[a, 0] == 0, x == a && y == 0]}, u,
  Element[{x, y}, mesh],
"ExtrapolationHandler" -> {(Indeterminate &),
 "WarningMessage" -> True}];
 ClearAll[f];
 f[x_, y_] := Evaluate[Grad[sol[x, y], {x, y}, "Cartesian"]]
  StreamPlot[f[x, y], {x, -1.51, 1.51}, {y, -1.51, 1.5},
AspectRatio -> Automatic,
 Frame -> False,
  Epilog -> {Thickness[0.005], Line[{{0, -L}, {0, L}}]}
]

StreamPlot[f[x, y], {x, -5 t, 5 t}, {y, L - 5 t, L + 5 t},
 AspectRatio -> Automatic,
 Frame -> False,
  Epilog -> {Line[{{t, 0}, {t, L}, {-t, L}, {-t, 0}}]},
  StreamPoints -> 50]
