2
$\begingroup$

I am trying to draw a surface of revolution recovered from a differential equation with a singularity. In the simplest case, the answer is a sphere. You can check by hand. I manage to draw 2 dimensional plot but the 3 dimensional plot doesn't work.

e = 0.0001;
NDSolve[{Sqrt[1 + (u'[t])^2] == 1/(Sqrt[1 - t^2]), u[0.9999999] == 0}, u, {t, e, 1 - e}]
Plot[Evaluate[u[t] /. %], {t, e, 1 - e}, PlotRange -> All, AspectRatio -> Automatic]

--works

RevolutionPlot3D[Evaluate[u[t] /. %], {t, e, 1 - e}]

--doesn't work

What is the major difference? Do you have any idea how to fix it?

Thank you

$\endgroup$

1 Answer 1

4
$\begingroup$

The difference is that if you pass a list as the first argument to RevolutionPlot3D the list is interpreted as {f[x],f[z]} if the list has two elements, or as {f[x],f[y],f[z]} if it has three elements. On the contrary, Plot simply plots each function in the list separately. To fix it, you can do

e = 0.0001;
{u1,u2} = NDSolve[{Sqrt[1 + (u'[t])^2] == 1/(Sqrt[1 - t^2]), 
  u[0.9999999] == 0}, u, {t, e, 1 - e}];

and then either

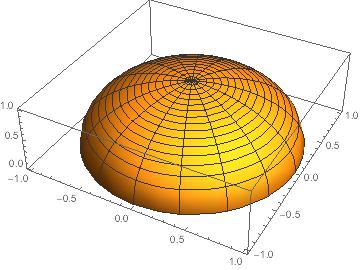
RevolutionPlot3D[Evaluate[u[t] /. u1], {t, e, 1 - e}]

or

RevolutionPlot3D[Evaluate[u[t] /. u2], {t, e, 1 - e}]

The first one gives

enter image description here

$\endgroup$

Your Answer

By clicking “Post Your Answer”, you agree to our terms of service and acknowledge you have read our privacy policy.

Not the answer you're looking for? Browse other questions tagged or ask your own question.