3
$\begingroup$
\[Psi] = u /. 
   First@NDSolve[{I D[u[t, x, y], t] == -D[u[t, x, y], {x, 2}] - 
        D[u[t, x, y], {y, 2}], 
      u[0., x, y] == 
       Sqrt[1/1.98944]*1/(2*Pi*0.2^2)*
        Exp[-1/2*((x^2)/0.2^2 + (y)^2/0.2^2)], 
      u[t, -5., y] == u[t, 5., y] == u[t, x, -5.] == u[t, x, 5.] == 
       0}, u, {t, 0., 2.}, {x, -5., 5.}, {y, -5., 5.}, 
     Method -> {"MethodOfLines", 
       "SpatialDiscretization" -> {"TensorProductGrid", 
         "DifferenceOrder" -> "Pseudospectral"}}, PrecisionGoal -> 2, 
     MaxSteps -> Infinity];

when I try to evaluate this, it runs for maybe 15minutes, gobbles up all available ram and then crashes. Is there any way for me to fix it (putting constraints on how much memory mathematica can acess) or better yet, a more efficient way of doing these calculations? if I dont force the boundary conditions to be 0, this evaluates in a blink of an eye.

https://www.youtube.com/watch?v=ee4LqXRlQmE at 3min in this video you see what I am trying to plot.

I created this with the help of Jens solution. I just increased the number of points and Plotted the Probablity Density (Read psi^2) wavegif thx again Jens, Im still trying go wrap my head around how your code works exactly:) Im not all that used to the Mathematica syntax yet

Im mostly having trouble following you where you define your c[] array (I assume fourier coefficients?) and I think I dont quite understand what is happening when you use [#,#2]

Awesome answer thx!

$\endgroup$
9
  • $\begingroup$ What you did here is take the approach from this answer and made two changes: narrowed the initial wave packet, requiring a lot more spatial points for an accurate discretization, and changed the boundary conditions from periodic to Dirichlet, which is inconsistent with the pseudospectral method. $\endgroup$
    – Jens
    Commented Apr 21, 2015 at 15:07
  • $\begingroup$ A more efficient approach for this simple example would be to expand in eigenfunctions of the time-independent equation with Dirichlet conditions. $\endgroup$
    – Jens
    Commented Apr 21, 2015 at 15:08
  • $\begingroup$ Oh I didnt mean to pretend I came up with all of this on my own, yes I also normalized the wavefunction so that psi^2 integrated = 1. thanks for pointing out the problem with pseudospectral method. Im not sure I understand you on your second point. this was ment to be more of a demo problem to calculate more difficult problems later on. so for general solutions to the 2-d particle in a box problem wouldnt I need the time dependant version? say for an arbitrary normalized psi[x,y,0]? $\endgroup$
    – catadoxas
    Commented Apr 21, 2015 at 15:37
  • $\begingroup$ I would not mind long computation times btw. If I can run it over night id be fine with it $\endgroup$
    – catadoxas
    Commented Apr 21, 2015 at 15:38
  • $\begingroup$ Maybe I can add some more explanations later. The Array with slots # is a shorter way of constructing one of the lists I need. You could do the same with another Table construct. Array is just shorter sometimes, especially here since it doesn't require me to define an additional table index variable. The slots # and #2 are then the stand0ins for the table indices I didn't want to name. $\endgroup$
    – Jens
    Commented Apr 21, 2015 at 21:07

1 Answer 1

7
$\begingroup$

Since there is no spatially or temporally varying potential energy term in the differential equation, it's not efficient to apply NDSolve with the method of lines. The Dirichlet boundary conditions are in principle also inconsistent with the Gaussian initial condition, so one should choose an initial condition that is forced to be zero at the boundary. The narrow initial packet requires a large spatial grid.

To get around this, it's better to expand in the known eigenfunctions of the time-independent Schrödinger equation for the box. Here is a function that does this:

Options[evolve2D] = {PlotPoints -> 10}; 
evolve2D[ψinitial_, {x_, xMin_, xMax_}, {y_, yMin_, yMax_}, t_, 
  OptionsPattern[]] := Module[
  {lx, ly, n, δ, data, ψBox, basis, dim, c, amplitudes},
  lx = xMax - xMin;
  ly = yMax - yMin;
  ψBox[μ_, ν_] := 
   Sin[(μ Pi (x - xMin))/lx] Sin[(ν Pi (y - yMin))/ly];
  n = OptionValue[PlotPoints];
  δ = N[Min[lx, ly]/n];
  data = Table[{x, y, ψinitial}, {x, xMin + δ/2, 
     xMax, δ}, {y, yMin + δ/2, yMax, δ}];
  dim = Most[Dimensions[data]];
  basis = Flatten[Array[c[#, #2] ψBox[#, #2] &, dim]];
  amplitudes = Flatten[Array[c[#, #2] &, dim]];
  Total[basis Flatten[
      Array[Exp[-I t ((#/lx)^2 + (#2/ly)^2)] &, dim]]] /. 
   FindFit[Flatten[data, 1], Total[basis], amplitudes, {x, y}]
  ]

ψ = evolve2D[Exp[-(x^2 + y^2)/.2^2], {x, -5, 5}, {y, -5, 5}, t, 
   PlotPoints -> 30];

frames = Table[
   DensityPlot[Evaluate[Re[ψ]], {x, -5, 5}, {y, -5, 5},
    PlotPoints -> 50, PlotRange -> All, MaxRecursion -> 1, 
    ColorFunction -> "BlueGreenYellow"],
   {t, 0, 12, .1}];

ListAnimate[frames]
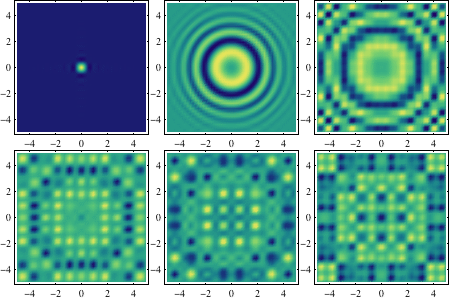
frames

The majority of the time is spent making the plots. The actual computation is very fast.

evolve2D is specially written for a rectangular box with Dirichlet boundary conditions, and it uses the known wave functions and energies for that problem.

You give it an arbitrary initial condition, that doesn't even have to be consistent with the boundary conditions. The function will take care of adapting the initial condition to an allowed form automatically. This works by using FindFit:

The initial condition is converted to a table of initial data on a grid of sampling points that are supposed to be chosen so they don't coincide with the nodal lines of the eigenfunctions $\psi_{\mu,\nu}(x,y)$. Then I ask FindFit to give me a set of expansion coefficients such that a superposition of eigenfunctions reproduces the given initial data in the best possible way. At that stage any conflict with the boundary conditions is removed, because the resulting fit of the initial data will always satisfy them, at the expense of introducing some deviation from the initial function in the domain, if necessary.

The range of indices for the eigenfunctions in my expansion is determined by the dimensions of the data grid representing the initial values. I.e., the number of basis functions with unknown coefficients is equal to the number of initial data given by the initial wave function. The number of sampling points is determined by the option PlotPoints.

Once I have the fit, the time evolution of the wave consists simply of multiplying each term in the eigenfunction superposition by its time-evolution factor $\exp(-i t E_{\mu,\nu})$ in dimensionless units (chosen such that the energies are simply $E_{\mu,\nu} = (\mu/L_x)^2+ (\nu/L_y)^2$, where $L_x$ and $L_y$ are the dimensions of the rectangular box.

$\endgroup$
2
  • $\begingroup$ thank you so much for that detailed answer, it helps a lot. A minor detail. since its a wavefunction you'd probably want to plot psi*Conjugate[psi] to get a plot of the probability density of the electrons position. I have to read trough all of this carefully now $\endgroup$
    – catadoxas
    Commented Apr 21, 2015 at 19:22
  • $\begingroup$ @catadoxas Sure, you can replace the Re by Abs[Psi]^2 if you prefer. In a more streamlined answer, one could also replace my FindFit approach with a Fourier series. But the advantage of using function fitting is that it can be generalized more easily to other systems where the eigenfunctions don't happen to be identical to sine waves, i.e., basis functions of the Fourier series. You could use the same method to plot wave packet evolution in a 2D harmonic oscillator, for example. One then would fit the initial packet to a superposition of HO eigenfunctions. $\endgroup$
    – Jens
    Commented Apr 21, 2015 at 20:05

Your Answer

By clicking “Post Your Answer”, you agree to our terms of service and acknowledge you have read our privacy policy.

Not the answer you're looking for? Browse other questions tagged or ask your own question.