12
$\begingroup$

Possible Duplicate:
Filling a polygon with a pattern of insets

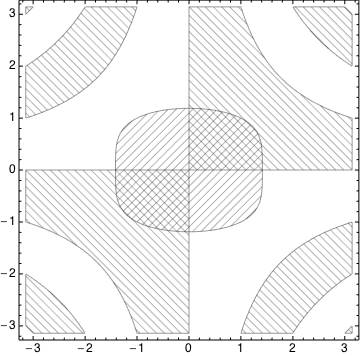
I have a RegionPlot (and sometimes a regular Plot) where I'd like to shade two different parts of it two different ways. Since the final output will be printed in black and white, I'd really like to do this in an old fashioned way: with hash lines.

I was mainly wondering if there is some built in way to do this without developing it from scratch.

$\endgroup$
1

1 Answer 1

20
$\begingroup$

For RegionPlot you could use the MeshFunctions option for this, for example

Show[
 RegionPlot[Sin[x y] > 0, {x, -Pi, Pi}, {y, -Pi, Pi}, 
  MeshFunctions -> {#1 + #2 &},
  Mesh -> {Range[-2 Pi, 2 Pi, Pi/20]}, PlotStyle -> None],
 RegionPlot[x^2 + y^4 < 2, {x, -Pi, Pi}, {y, -Pi, Pi}, 
  MeshFunctions -> {#1 - #2 &},
  Mesh -> {Range[-Pi, Pi, Pi/20]}, PlotStyle -> None]]

Mathematica graphics

$\endgroup$
3
  • 1
    $\begingroup$ Thanks and sorry for duplicating a previous post. I looked, but must not have used just the right search terms. $\endgroup$
    – JohnD
    Commented Jun 30, 2012 at 21:43
  • $\begingroup$ @texas That's okay, they are often not easy to find. We do appreciate your trying however. :-) $\endgroup$
    – Mr.Wizard
    Commented Jul 1, 2012 at 6:53
  • 1
    $\begingroup$ Very nice! Is there a way to get away with only one RegionPlot command? Similar to how PlotStyle accepts a list of specifications for each region being plotted. $\endgroup$
    – Eckhard
    Commented Feb 3, 2014 at 23:31

Not the answer you're looking for? Browse other questions tagged or ask your own question.