4
$\begingroup$

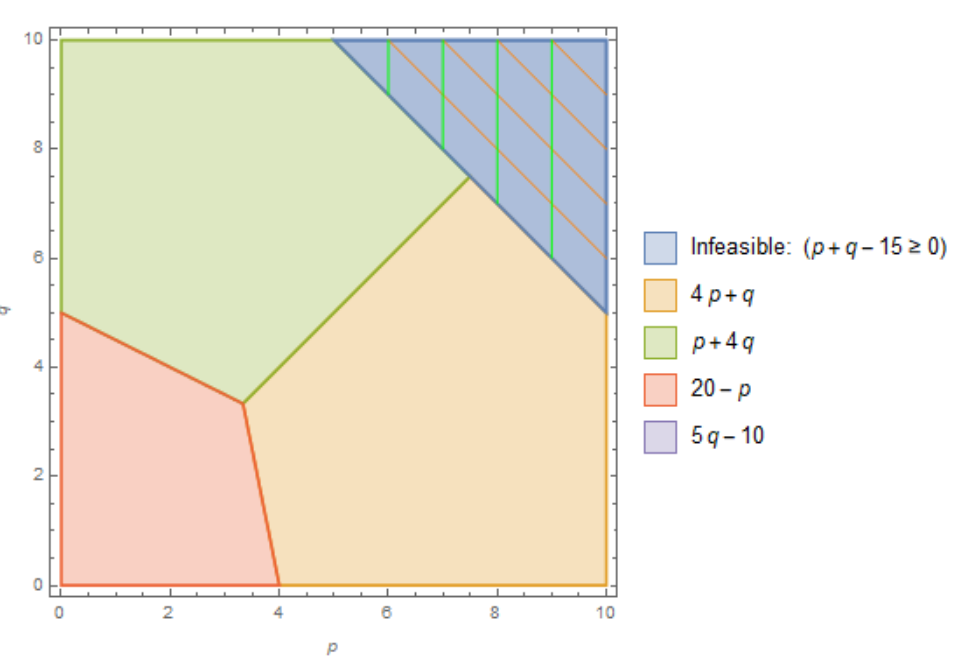
I have a set of inequations, which i'd like to plot as different regions with RegionPlot, which I defined by:

a = {-15 + p + q >= 0};
b = {4 p + q, 4 q + p, 20 - p, -10 + 5 q};
regions = Table[And[Not @@ a, And @@ (b <=  i // Thread)], {i, b}];

Then I'm plotting them like this:

RegionPlot[{a, regions}, {p, 0, 10}, {q, 0, 10}, 
 FrameLabel -> {p, q}, MaxRecursion -> 3, 
 MeshFunctions -> {#1 + #2 &, #1 &}, Mesh -> 10, 
 MeshStyle -> {Orange, Green}, 
 PlotLegends -> 
  SwatchLegend[Automatic, Prepend[b, "Infeasible: " And @@ a], 
   LegendMarkerSize -> {20, 20}]]
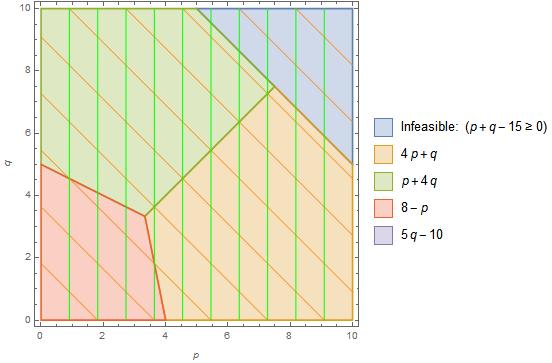
This produces:

example

Now, I'd actually like the mesh to only be applied to the first region (the one marked Infeasible), but instead it seems to be applied to the combinations of the regions plotted.

I know that it should be possible to Show, but then I don't see how I can combine the plots, create a proper Legend, which combines all parts of the plots. When I also to create a list of RegionPlots, I could not save the result of the RegionPlot (it simply showed up as Null).

Related questions, that don't quite answer my issue:

As a bonus, if you can show me at the same time how to make the line-spacing of the mesh independent of the size of the region, that would be greatly appreciated too.

$\endgroup$
2
  • $\begingroup$ Your code produces a different outcome than the plot you posted: imgur.com/a/tk9bP. Also, the PlotLegends -> .... is irrelevant for the question asked. Finally, I'm quite surprised that MeshFunctions -> ConditionalExpression[{#1 + #2 &, #1 &}, -15 + #1 + #2 >= 0 &] (and its variations) doesn't work. $\endgroup$
    – corey979
    Commented Sep 3, 2017 at 19:13
  • $\begingroup$ That's odd... even after clearing my globals, I still get a different plot than you. i.imgur.com/NOuHBEs.png As you see I'm using MM11.1 (on Windows 10). Were you under the impression that ConditionalExpression should have worked here? $\endgroup$
    – Joost
    Commented Sep 4, 2017 at 9:31

2 Answers 2

4
$\begingroup$

One possibility is to draw the mesh in a second plot and draw it over the original one:

Show[
 RegionPlot[
  {a, regions}, {p, 0, 10}, {q, 0, 10},
  FrameLabel -> {p, q},
  MaxRecursion -> 3,
  PlotLegends -> 
   SwatchLegend[Automatic, Prepend[b, "Infeasible: " And @@ a], 
    LegendMarkerSize -> {20, 20}]
  ],
 RegionPlot[
  a, {p, 0, 10}, {q, 0, 10},
  MeshFunctions -> {#1 + #2 &, #1 &},
  Mesh -> {Range[0, 20, 1]},
  MeshStyle -> {Orange, Green}]
 ]

enter image description here

The code above also demonstrates how to achieve size independent mesh spacing. The only thing to watch out for is that you might need to adjust the bounds of the Range to cover the values returned by your mesh functions.

$\endgroup$
1
  • 1
    $\begingroup$ That is great. Somehow I messed up the Legends call, by adding it to the second one. $\endgroup$
    – Joost
    Commented Sep 4, 2017 at 9:21
2
$\begingroup$

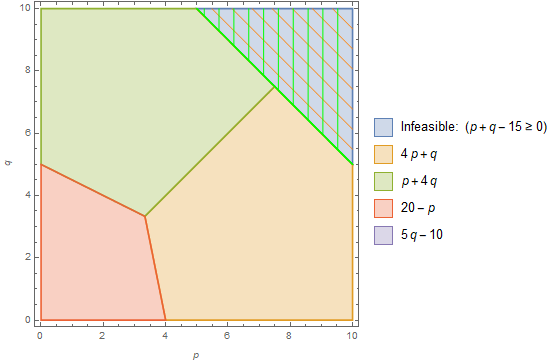
Update: It turns out we can use a simple modifications of the option setting in OP for MeshFunctions to get the desired result:

1. Boole:

RegionPlot[{a, regions}, {p, 0, 10}, {q, 0, 10},
 FrameLabel -> {p, q}, MaxRecursion -> 3, 
 MeshFunctions -> {Boole[# + #2 >= 15] (#1 + #2) &, Boole[# + #2 >= 15] #1 &}, 
 Mesh -> {30, 20}, 
 MeshStyle -> {Orange, Green}, 
 PlotLegends -> SwatchLegend[Automatic, Prepend[b, "Infeasible: " And @@ a], 
   LegendMarkerSize -> {20, 20}]]

enter image description here

Alternatively, specify a list of values for each mesh function using, for example, Mesh -> {Range[15, 30, .5], Range[0, 10, .25]} to get
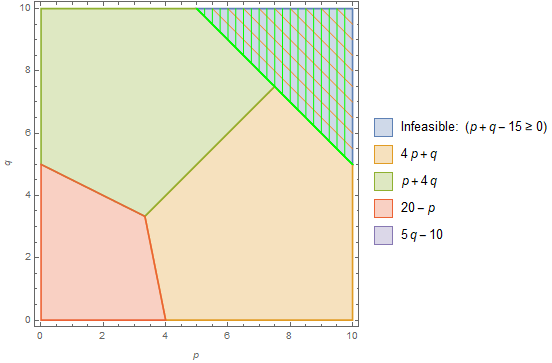
enter image description here

2. Piecewise:

We can also use

MeshFunctions -> {Piecewise[{{#1 + #2, # + #2 >= 15}}] &, 
  Piecewise[{{#1, # + #2 >= 15}}] &}

to get the same result.

3. ConditionalExpression:

Finally, we can use ConditionalExpression if we use list of values for the Mesh option setting (and increase PlotPoints to remove artifacts):

RegionPlot[{a, regions}, {p, 0, 10}, {q, 0, 10},
 FrameLabel -> {p, q}, MaxRecursion -> 3, 
 MeshFunctions -> {ConditionalExpression[#1 + #2, # + #2 >= 15] &, 
   ConditionalExpression[#1, # + #2 >= 15] &}, 
 Mesh -> {Range[0, 20, .5], Range[0, 10, .5]}, 
 PlotPoints -> 100, 
 MeshStyle -> {Orange, Green}, 
 PlotLegends ->  SwatchLegend[Automatic, Prepend[b, "Infeasible: " And @@ a], 
   LegendMarkerSize -> {20, 20}]]
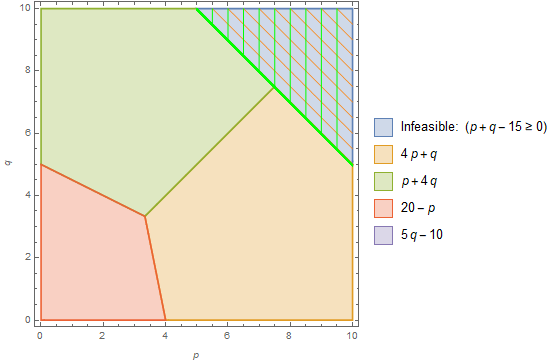
enter image description here

Original answer:

An alternative approach: Use Texture[img] as the PlotStyle setting for the desired regions using img of your choice:

colors = ColorData[97] /@ Range[4];

texture1 = Texture[ExampleData[{"TestImage", "Mandrill"}]];

legendmarker1 = Graphics[{texture1, Polygon[{{0, 0}, {1, 0}, {1, 1}, {0, 1}}, 
     VertexTextureCoordinates -> Automatic]}];

RegionPlot[{a, regions}, {p, 0, 10}, {q, 0, 10}, FrameLabel -> {p, q},
 MaxRecursion -> 3, PlotStyle -> Prepend[colors, texture1],
 TextureCoordinateFunction -> (Rescale[{#, #2}, {0, 10}/2] &),
 TextureCoordinateScaling -> False, 
 PlotLegends -> SwatchLegend[Prepend[colors, texture1], 
   Prepend[b, Row[{"Infeasible:  ", And @@ a}]], 
   LegendMarkers -> Prepend[ConstantArray[Automatic, Length@b], legendmarker1],
   LegendMarkerSize -> {30, 30}]]
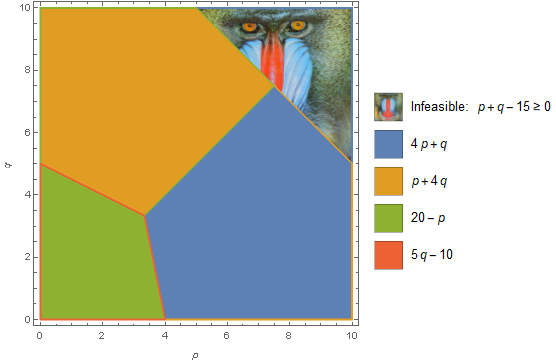
enter image description here

To use a hatched image instead of "Mandrill", you can use a simplified version of the function hatchingF from this answer

ClearAll[hatchedTexture]
hatchedTexture[ps_: None, cols_: {Red, Orange}, m_: {10, 10}, 
  t_: AbsoluteThickness[5]] := 
 RegionPlot[True, {x, 0, 1}, {y, 0, 1}, 
  MeshFunctions -> {# + #2 &, # &}, Mesh -> m, MeshShading -> None, 
  MeshStyle -> (Directive[t, #] & /@ cols), Frame -> False, 
  PlotRangePadding -> 0, PlotStyle -> ps, BaseStyle -> EdgeForm[], 
  BoundaryStyle -> None]

Replace texture1 and legendmarker1 above with

texture2 = Texture[Rasterize @ hatchedTexture[]];
legendmarker2 = Graphics[{texture2, Polygon[coords = {{0, 0}, {1, 0}, {1, 1}, {0, 1}}, 
     VertexTextureCoordinates -> (coords/2)]}];

to get
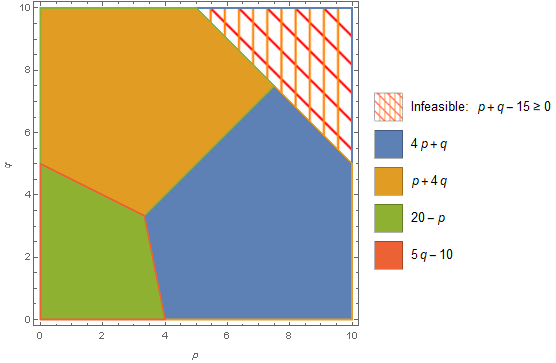
enter image description here

Use texture2 = Texture[Rasterize @ hatchedTexture[LightBlue]] to get
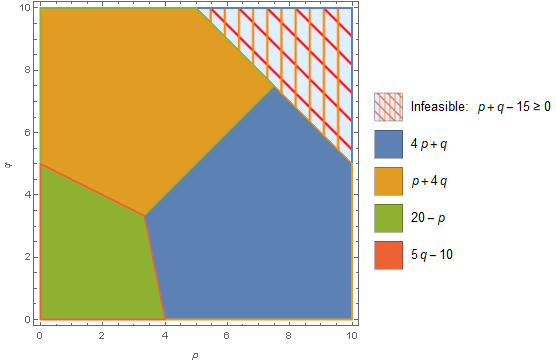
enter image description here

Use texture2 = Texture[Rasterize @ hatchedTexture[texture1, {Black, Black}]] if you wish to be cruel and put "Mandrill" behind bars:
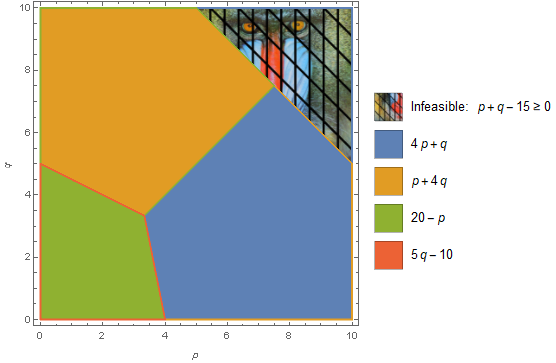
enter image description here

$\endgroup$

Your Answer

By clicking “Post Your Answer”, you agree to our terms of service and acknowledge you have read our privacy policy.

Not the answer you're looking for? Browse other questions tagged or ask your own question.