0
$\begingroup$
lmax=5.8;a=.804;
NDSolve[{PH'[l]==X[l]^2/a^3,PH[0]==0.,AR'[l]==Y[l] Cos[PH[l]],Y'[l]==Sin[PH[l]],Y[0]==0.,X'[l]==Cos[PH[l]],X[0]==0.,AR[0]==0},{PH,X,Y,AR},{l,0,lmax}];
{ph[u_],x[u_],y[u_],ar[u_]}={PH[u],X[u],Y[u],AR[u]}/.First[%];
ParametricPlot[{x[l],y[l]},{l,0,lmax}];
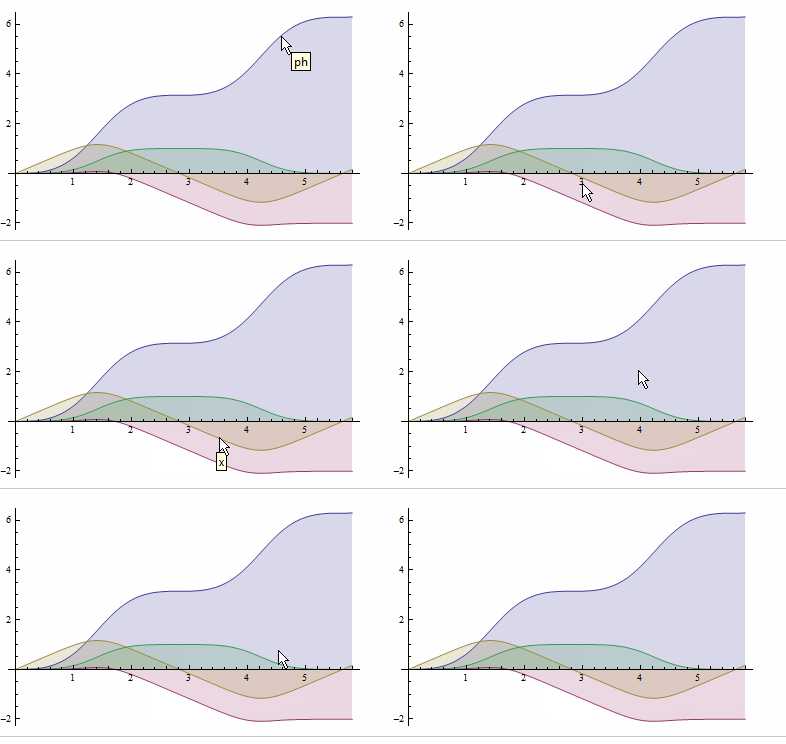
Plot[Tooltip[{ph[l],ar[l],  x  [l],y[l] }],{l,0,lmax}]

I prefer the Tootip to read labels ph,ar, x,y as named but not again echo the same "Interpolating Function" [...]

$\endgroup$
2
  • 2
    $\begingroup$ Plot[Evaluate[Tooltip[#[l], #] & /@ {ph, ar, x, y}], {l, 0, lmax}] $\endgroup$
    – Bob Hanlon
    Commented Feb 9, 2015 at 17:12
  • $\begingroup$ Thanks Bob, no more living with this problem ! $\endgroup$
    – Narasimham
    Commented Feb 9, 2015 at 17:34

1 Answer 1

3
$\begingroup$
flist = {ph, ar, x, y};

The most straightforward approach is the one suggested by @Bob Hanlon in the comments section: Plot[Tooltip[#@l, #] & /@ flist, {l, 0, lmax}, Evaluated -> True].

The following unusual usage of the option PlotStyle also gives the desired result:

Plot[Through@flist@l, {l, 0, lmax}, Evaluated -> True, Filling -> Axis,
 PlotStyle -> (Function[t, Tooltip[#, t] &] /@ flist)]

enter image description here

You can also add tooltips via post-processing:

Block[{j = 1}, Plot[Through@flist@l, {l, 0, lmax}, Evaluated -> True, Filling -> Axis] /. 
      Line[x_] :> Tooltip[Line[x], flist[[j++]]]]
(* same picture *)
$\endgroup$
1
  • $\begingroup$ Arrow position does not cycle,( my Ver8?) $\endgroup$
    – Narasimham
    Commented Feb 10, 2015 at 5:06

Your Answer

By clicking “Post Your Answer”, you agree to our terms of service and acknowledge you have read our privacy policy.

Not the answer you're looking for? Browse other questions tagged or ask your own question.