Given that I have two variables $\theta,t$, for the varible $t$, $\theta$ always owns several values. Namely, $$\{t,\theta_1,\theta_2,\theta_3,\theta_4...\}$$ where $t$ in the interval$[0,1]$ and $\theta$ in the interval$[0,2\pi]$
My sample data
originalData=
{{0,2.99939,6.16435},{0.010101,3.03635,6.19686},{0.020202,3.07484,6.22946},
 {0.030303,3.11493,6.26213},{0.040404,0.011674,3.15666},
 {0.0505051,0.0444528,3.20004},{0.0606061,0.0772844,3.24504},
 {0.0707071,0.110179,3.29156},{0.0808081,0.143159,3.33945},
 {0.0909091,0.176258,3.38851},{0.10101,0.209527,3.43847},{0.111111,0.243035,3.48904},
 {0.121212,0.276879,3.53988},{0.131313,0.311186,3.59066},{0.141414,0.346126,3.64109},
 {0.151515,0.381932,3.69088},{0.161616,0.418919,3.73981},{0.171717,0.457536,3.78768},
 {0.181818,0.498437,3.83436},{0.191919,0.54263,3.87976},{0.20202,0.591793,3.92382},
 {0.212121,0.649054,3.96653},{0.222222,0.7215,4.00787},
 {0.232323,1.79066,1.4441,0.834008,4.0479},{0.242424,2.04691,4.08662},
 {0.252525,2.17701,4.12412},{0.262626,2.27155,4.16044},
 {0.272727,2.3473,4.19565},{0.282828,2.41109,4.22982},{0.292929,2.46649,4.26302},
 {0.30303,2.51566,4.29532},{0.313131,2.56,4.3268},{0.323232,2.60048,4.35752},
 {0.333333,2.63783,4.38756},{0.343434,2.67258,4.41699},{0.353535,2.70514,4.44588},
 {0.363636,2.73583,4.47429},{0.373737,2.76491,4.5023},{0.383838,2.79261,4.52997},
 {0.393939,2.81908,4.55739},{0.40404,2.84448,4.58461},{0.414141,2.86894,4.61171},
 {0.424242,2.89255,4.63878},{0.434343,2.91541,4.66589},{0.444444,2.9376,4.69313},
 {0.454545,2.95918,4.7206},{0.464646,2.9802,4.74841},{0.474747,3.00073,4.77666},
 {0.484848,3.02081,4.8055},{0.494949,3.04048,4.83508},{0.505051,3.05977,4.86559},
 {0.515152,3.07872,4.89726},{0.525253,3.09736,4.93036},
 {0.535354,3.1157,0.308209,0.214389,4.96529},
 {0.545455,3.13379,0.428984,0.0480804,5.0025},
 {0.555556,0.485269,6.22645,5.04269,3.15163},
 {0.565657,0.526307,6.13285,5.08687,3.16925},
 {0.575758,0.55954,6.0414,5.13667,3.18666},
 {0.585859,0.587877,5.94624,5.19502,3.20387},
 {0.59596,0.612803,5.83937,5.26845,3.22092},
 {0.606061,0.635191,5.69654,5.38031,3.2378},{0.616162,0.655606,3.25452},
 {0.626263,0.674433,3.27111},{0.636364,0.691951,3.28758},{0.646465,0.708367,3.30392},
 {0.656566,0.72384,3.32015},{0.666667,0.738494,3.33628},{0.676768,0.75243,3.35231},
 {0.686869,0.765729,3.36826},{0.69697,0.778458,3.38412},{0.707071,0.790675,3.3999},
 {0.717172,0.802427,3.41561},{0.727273,0.813756,3.43125},{0.737374,0.824695,3.44683},
 {0.747475,0.835277,3.46235},{0.757576,0.845527,3.4778},{0.767677,0.85547,3.4932},
 {0.777778,0.865127,3.50855},{0.787879,0.874516,3.52384},{0.79798,0.883655,3.53909},
 {0.808081,0.892558,3.55428},{0.818182,0.901239,3.56942},{0.828283,0.90971,3.58452},
 {0.838384,0.917984,3.59956},{0.848485,0.92607,3.61456},{0.858586,0.933978,3.6295},
 {0.868687,0.941717,3.64439},{0.878788,0.949295,3.65923},{0.888889,0.956718,3.67401},
 {0.89899,0.963995,3.68873},{0.909091,0.971132,3.70339},{0.919192,0.978135,3.71798},
 {0.929293,0.985008,3.73251},{0.939394,0.991759,3.74697},{0.949495,0.998391,3.76135},
 {0.959596,1.00491,3.77566},{0.969697,1.01132,3.78988},{0.979798,1.01762,3.80402},
 {0.989899,1.02382,3.81806},{1.,1.02993,3.83201}};
My goal
I would like to plot independent curves according these discrete points in one graphic.
My trial
Firstly, I visualize these discrete points and show them in one graphic:
 Data1 = Thread@{originalData[[All, 1]], originalData[[All, 2]]};
 Data2 = Thread@{originalData[[All, 1]], originalData[[All, 3]]};
 middle = Cases[originalData, {_, _, _, _, _}];
 Data3 = Thread@{middle[[All, 1]], middle[[All, 4]]};
 Data4 = Thread@{middle[[All, 1]], middle[[All, 5]]};
 Show[
  ListPlot[#1, PlotStyle -> {#2, PointSize[Small]}] & @@@
   (Thread@{{Data1, Data2, Data3, Data4}, {Red, Blue, Black, Green}}),
   AxesOrigin -> {0, -1}, ImageSize -> 700,
   PlotRange -> {{0, 1}, {-1, 7}},
   GridLines -> {{}, {0, 2 \[Pi]}}, AxesStyle -> Arrowheads[.02],
   GridLinesStyle -> Directive[RGBColor[1, 0, 1], Dashed],
   AxesLabel -> (Style[#, 15, Red, Italic,
   FontFamily -> "Helvetica"] & /@ {"t", "\[Theta]"})]
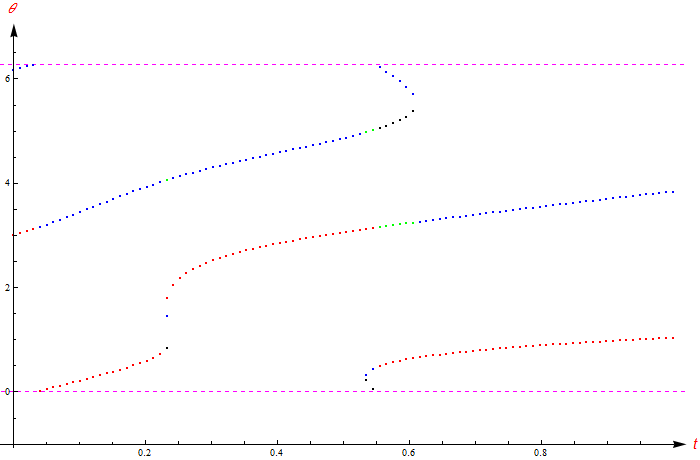
By the visualizstion of ListPlot and Show, I know that there are 4 part(Part 1,Part 2,Part 3,Part 4) subpictures in this graphic.
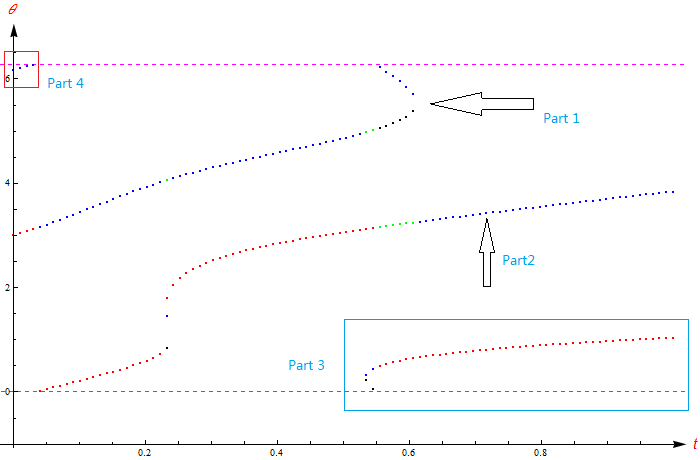
My question(difficulty)
1,Is it possible to connect the the disrete points of Part $i$.Namely, make the Part $i$ become a continuous curve?
2,Now I have no idea to solve this problem, so if possible, can someone give some suggestions (algorithm or hint)? Thanks in advance:-)

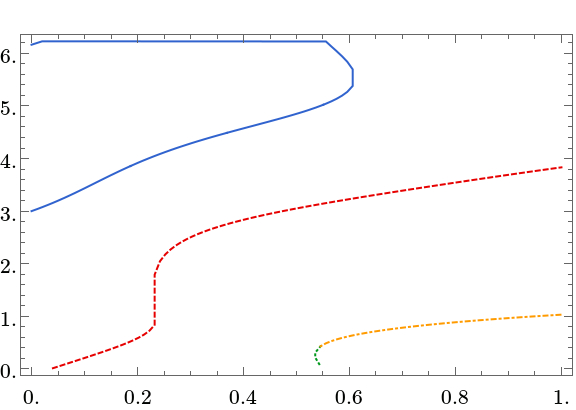
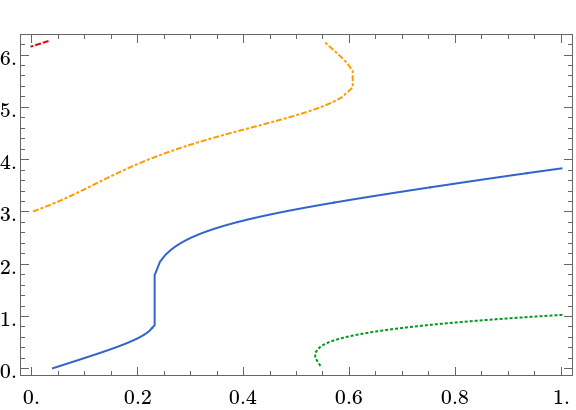
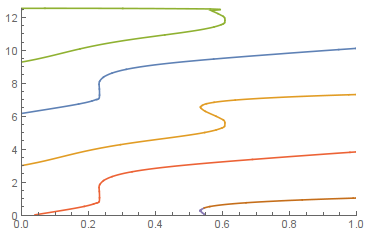
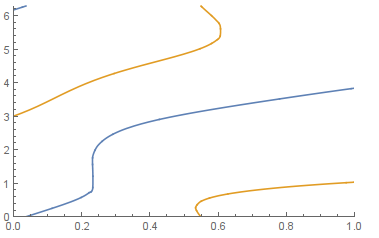
Nearestor similar to stitch your point sets together. Other possibly (?) useful functions:FindCurvePathandFindShortestTour. $\endgroup$