7
$\begingroup$

Consider you want to plot R = ImplicitRegion[x > 0 && y == -((5 x)/3), {x, y}];

In ContourPlot of an ImplicitRegion defined by the intersecton of equality and inequality, it turns out that

RegionPlot[R, PlotRange -> {{-10, 10}, {-10, 10}}]

and

RegionPlot[R, {x, -10, 10}, {y, -10, 10}]

behave differently, and in particular the former works while the latter does not, giving the error

ImplicitRegion::bcond: "ImplicitRegion[x>0&&y==-((5\x)/3),{x,y}] should be a Boolean combination of equations, inequalities, and Element statements."

Any idea on the reason? In particular, the documentation reports the latter as the correct syntax to use (and the former as an optional form) so I would expect it to work.

$\endgroup$

1 Answer 1

3
$\begingroup$

The documentation for RegionPlot in V10 has not been updated properly. It omits a new argument pattern now accepted by RegionPlot. That argument pattern is

RegionPlot[region, options]

The new pattern is documented under ImplicitRegion and ParametricRegion.

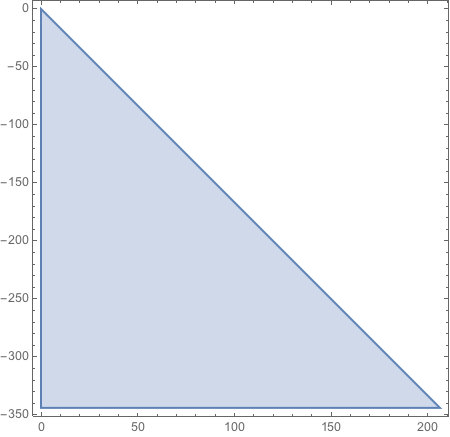
So two ways to get a region plot of the region under the line y == -[5/3) x and to right of the y-axis are

 RegionPlot[x > 0 && y < -(5/3) x, {x, 0, 200}, {y, -333, 0}]

and

RegionPlot[ImplicitRegion[x > 0 && y < -(5/3) x, {x, y}]]

Both return a plot that appears as follows:

plot

The form

RegionPlot[ImplicitRegion[x > 0 && y < -(5/3) x, {x, y}], {x, -10, 10}, {y, -10, 10}]

does not match the new argument pattern nor the old one, so you get an error message.

Edit

This additional information is supplied to answer issues raised by the OP in a comment below.

  • To see an example where the new pattern is used, look at the 1st example given under Basic Examples under ImplicitRegion.

  • I chose the region defined by x > 0 && y < -(5/3) x because it has non-zero measure and will be visible in both forms of RegionPlot. As the documentation says under Details inRegionPlot,

RegionPlot can in general only find regions of positive measure; it cannot find regions that are just lines or points.

This does not seem to apply to the new form, but it certainly applies to the older form.

$\endgroup$
1
  • $\begingroup$ I can't find the new pattern neither on the documentation of ImplicitRegion nor in that of ParametricRegion. Which documentation are you referring? Also, you plotted the wrong region. With x > 0 && y == -((5 x)/3) I got a blank plot with RegionPlot[x > 0 && y == -((5 x)/3), {x, 0, 200}, {y, -333, 0}] -- but no errors $\endgroup$
    – Nicola
    Commented Oct 29, 2014 at 6:34

Your Answer

By clicking “Post Your Answer”, you agree to our terms of service and acknowledge you have read our privacy policy.

Not the answer you're looking for? Browse other questions tagged or ask your own question.