I want to plot a line defined IMPLICITLY by the intersection of an equality and an inequality, i.e. a line that you can't easily simplify (and therefore take advantage of its form). Consider for instance the simple example
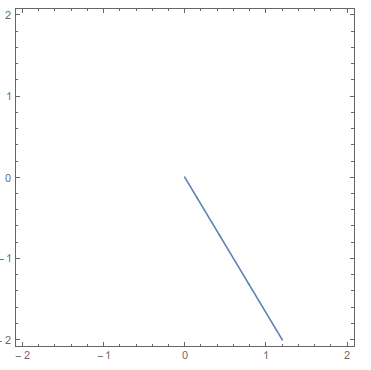
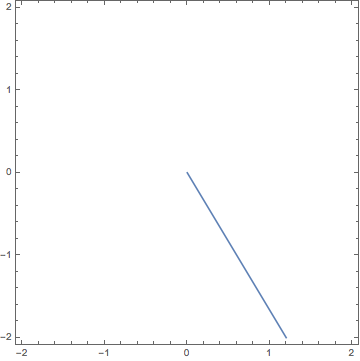
R=x > 0 && y == -((5 x)/3)
but assume you don't know which equalities and inequalities it involves (although you know it's a line and not a 2D region).
How can I plot the set R? I can't use RegionPlot as it only consider regions defined by inequalities, but at the same time ContourPlot
ContourPlot[R, {x, -2, 2}, {y, -2, 2}]
does not work.
I know there is the function ImplicitRegion, but
ContourPlot[ImplicitRegion[R, {x, y}], {x, -2, 2}, {y, -2, 2}]
does not work either.
I repeat, do not take advantage of the expressions in R - if you could a solution is to use ContourPlot with RegionFunction.
PS this question is related to Integration over a (non-parametric) curve defined by indicator function


RegionPlotuseful ? $\endgroup$RegionPlot+ImplicitRegionworks for me. i.sstatic.net/e4C9m.png $\endgroup$ContourPlotwork here. Before the region functionality of V10,RegionPlotwould have failed miserably on such a problem. To satisfy the OP's constraint is difficult withContourPlot. $\endgroup$RegionPlotthe best approach. It seems to me that if one looks at an object as a contour, one would naturally considerContourPlot. If other plotters work with regions, why notContourPlot? (It's not a ground-breaking question to be sure, but I think it passes muster.) Thanks, in any case. $\endgroup$