By the upper Mr. Jason B.'s nice codes on TwoAxisListPlot, I made one on DateListPlot as TwoAxisDateListPlot as following, some notations listed for helping others to change it to other ***Plot cases.
TwoAxisDateListPlot[{datelistLeft_?ListQ, dateListRight_?ListQ},opts : OptionsPattern[]] :=
    Module[ {shapedListRight, plotLeft, plotRight, twoRanges, result},

        (*check lists' depth*)
        If[ Or[ArrayDepth@datelistLeft != 2, ArrayDepth@dateListRight != 2],
            Return[$Failed]
        ];

        (* to be reshaped*)
        shapedListRight = dateListRight;

        (*find plots'Ranges*)
        {plotLeft, plotRight} =
         DateListPlot /@ {datelistLeft, shapedListRight};
        twoRanges =
         Last@Charting`get2DPlotRange@# & /@ {plotLeft, plotRight};

        (*reshape dataRight*)
        shapedListRight[[;; , 2]] =
         Rescale[shapedListRight[[;; , 2]], Last@twoRanges, First@twoRanges];

        (*draw together*)
        result = DateListPlot[{datelistLeft, shapedListRight},
          Frame -> True,
          FrameTicks -> {{Automatic,
             Charting`FindTicks[First@twoRanges,
              Last@twoRanges]}, {Automatic, Automatic}},
          FrameStyle -> {{ColorData[97][1], ColorData[97][2]}, {Automatic,
             Automatic}}, FilterRules[{opts}, Options[DateListPlot]]];

        (*return shaped plots*)
        Return[result];
    ]
TwoAxisDateListPlot[datelistLeft_?ListQ, dateListRight_?ListQ, opts : OptionsPattern[]] := TwoAxisDateListPlot[{datelistLeft, dateListRight}, opts]
simple demos as :
list1 = FinancialData["NYSE:IBM", "March. 8, 2015"];
list2 = FinancialData["NASDAQ:AAPL", "March. 8, 2015"];

TwoAxisDateListPlot[list1, list2]
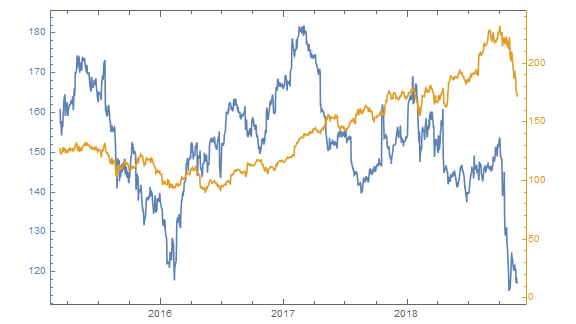
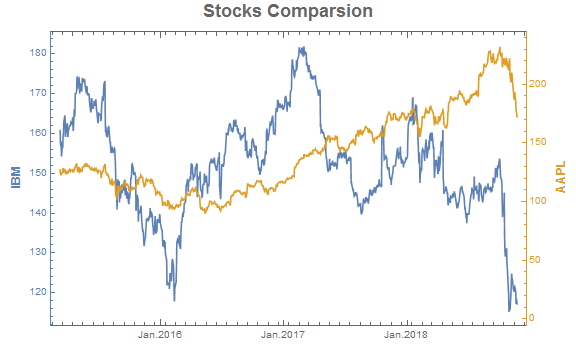
If some options given, it shows as this.
TwoAxisDateListPlot[list1, list2,
 DateTicksFormat -> {"MonthNameShort", ".", "Year"},
 FrameLabel -> {{Style["IBM", Larger, Bold],
    Style["AAPL", Larger, Bold]}, {None, None}},
 PlotLabel -> Style["Stocks Comparsion", 18, Bold]
 ]
If PlotTheme be used, a new version comes up
 TwoAxisDateListPlot[{datelistLeft_?ListQ, dateListRight_?ListQ}, opts : OptionsPattern[]] :=
        Module[ {shapedListRight, plotLeft, plotRight, twoRanges, theme, colors, result},

           (*check lists' depth*)
            If[ Or[ArrayDepth@datelistLeft != 2, ArrayDepth@dateListRight != 2],
                Return[$Failed]
            ];

            (*get colors*)
            theme = Lookup[Association[opts], PlotTheme, Automatic];
            colors =
             Most /@ PadRight[{}, {2},
               "DefaultPlotStyle" /. (Method /.
                  Charting`ResolvePlotTheme[theme, DateListPlot])];

            (* to be reshaped*)
            shapedListRight = dateListRight;

            (*find plots'Ranges*)
            {plotLeft, plotRight} =
             DateListPlot /@ {datelistLeft, shapedListRight};
            twoRanges =
             Last@Charting`get2DPlotRange@# & /@ {plotLeft, plotRight};

            (*reshape dataRight*)
            shapedListRight[[;; , 2]] =
             Rescale[shapedListRight[[;; , 2]], Last@twoRanges, First@twoRanges];

            (*draw together*)
            result = DateListPlot[{datelistLeft, shapedListRight},
              Frame -> True,
              FrameTicks -> {{Automatic,
                 Charting`FindTicks[First@twoRanges,
                  Last@twoRanges]}, {Automatic, Automatic}},
              FrameStyle -> {colors, {Automatic, Automatic}},
              FilterRules[{opts}, Options[DateListPlot]]];

            (*return shaped plots*)
            Return[result];
        ]
    TwoAxisDateListPlot[datelistLeft_?ListQ, dateListRight_?ListQ, opts : OptionsPattern[]] := TwoAxisDateListPlot[{datelistLeft, dateListRight}, opts]
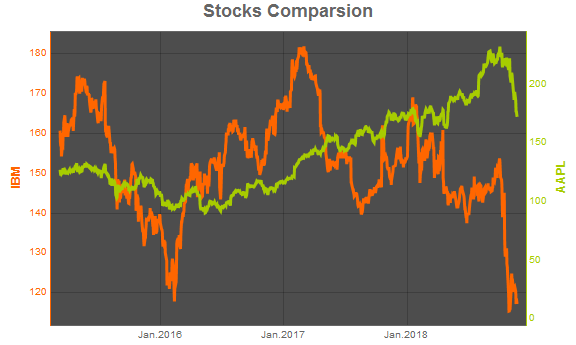
demos as
TwoAxisDateListPlot[list1, list2,
 DateTicksFormat -> {"MonthNameShort", ".", "Year"},
 FrameLabel -> {{Style["IBM", Larger, Bold],
    Style["AAPL", Larger, Bold]}, {None, None}},
 PlotLabel -> Style["Stocks Comparsion", 18, Bold],
 PlotTheme -> "Marketing"
 ]
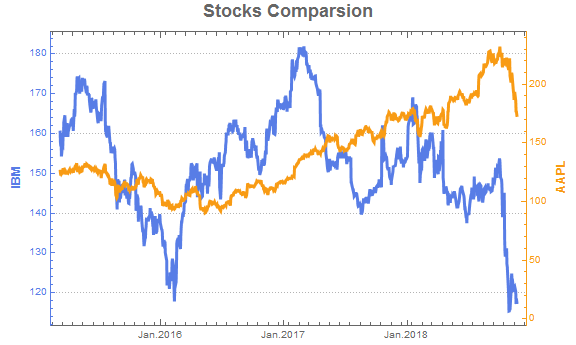
or
TwoAxisDateListPlot[list1, list2,
 DateTicksFormat -> {"MonthNameShort", ".", "Year"},
 FrameLabel -> {{Style["IBM", Larger, Bold],
    Style["AAPL", Larger, Bold]}, {None, None}},
 PlotLabel -> Style["Stocks Comparsion", 18, Bold],
 PlotTheme -> "Business"
 ]
or
TwoAxisDateListPlot[list1, list2,
 DateTicksFormat -> {"MonthNameShort", ".", "Year"},
 FrameLabel -> {{Style["IBM", Larger, Bold],
    Style["AAPL", Larger, Bold]}, {None, None}},
 PlotLabel -> Style["Stocks Comparsion", 18, Bold],
 PlotTheme -> "Detailed"
 ]
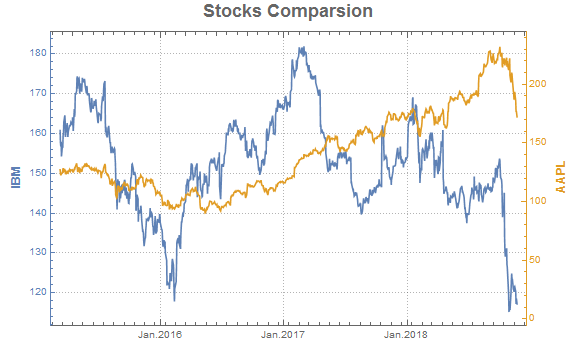
There's always one for using.

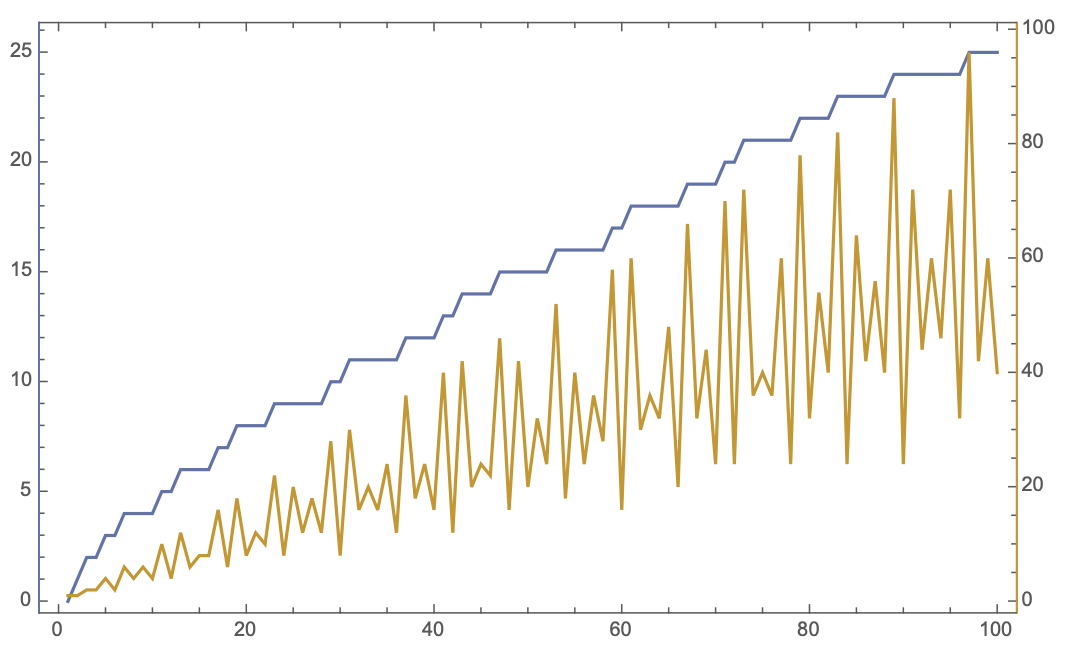
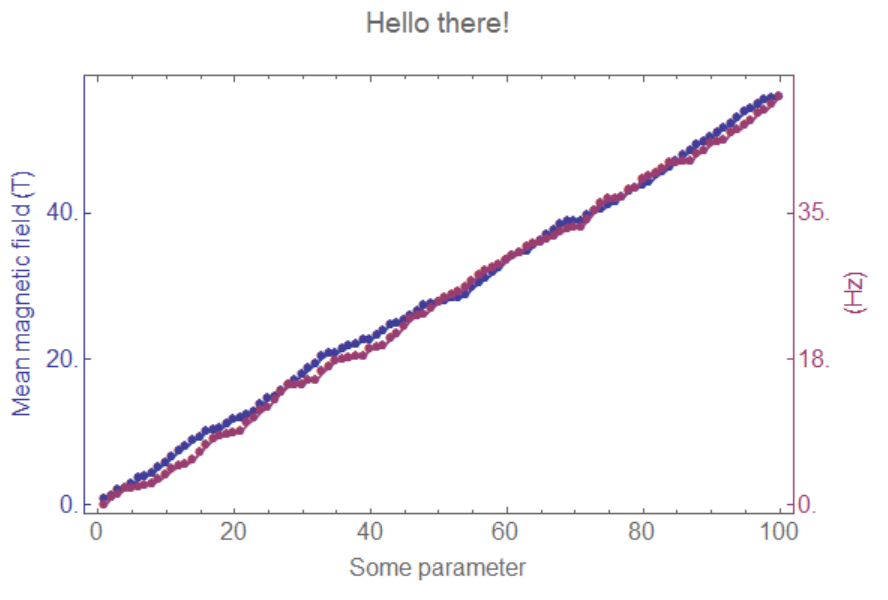
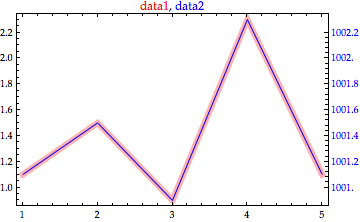
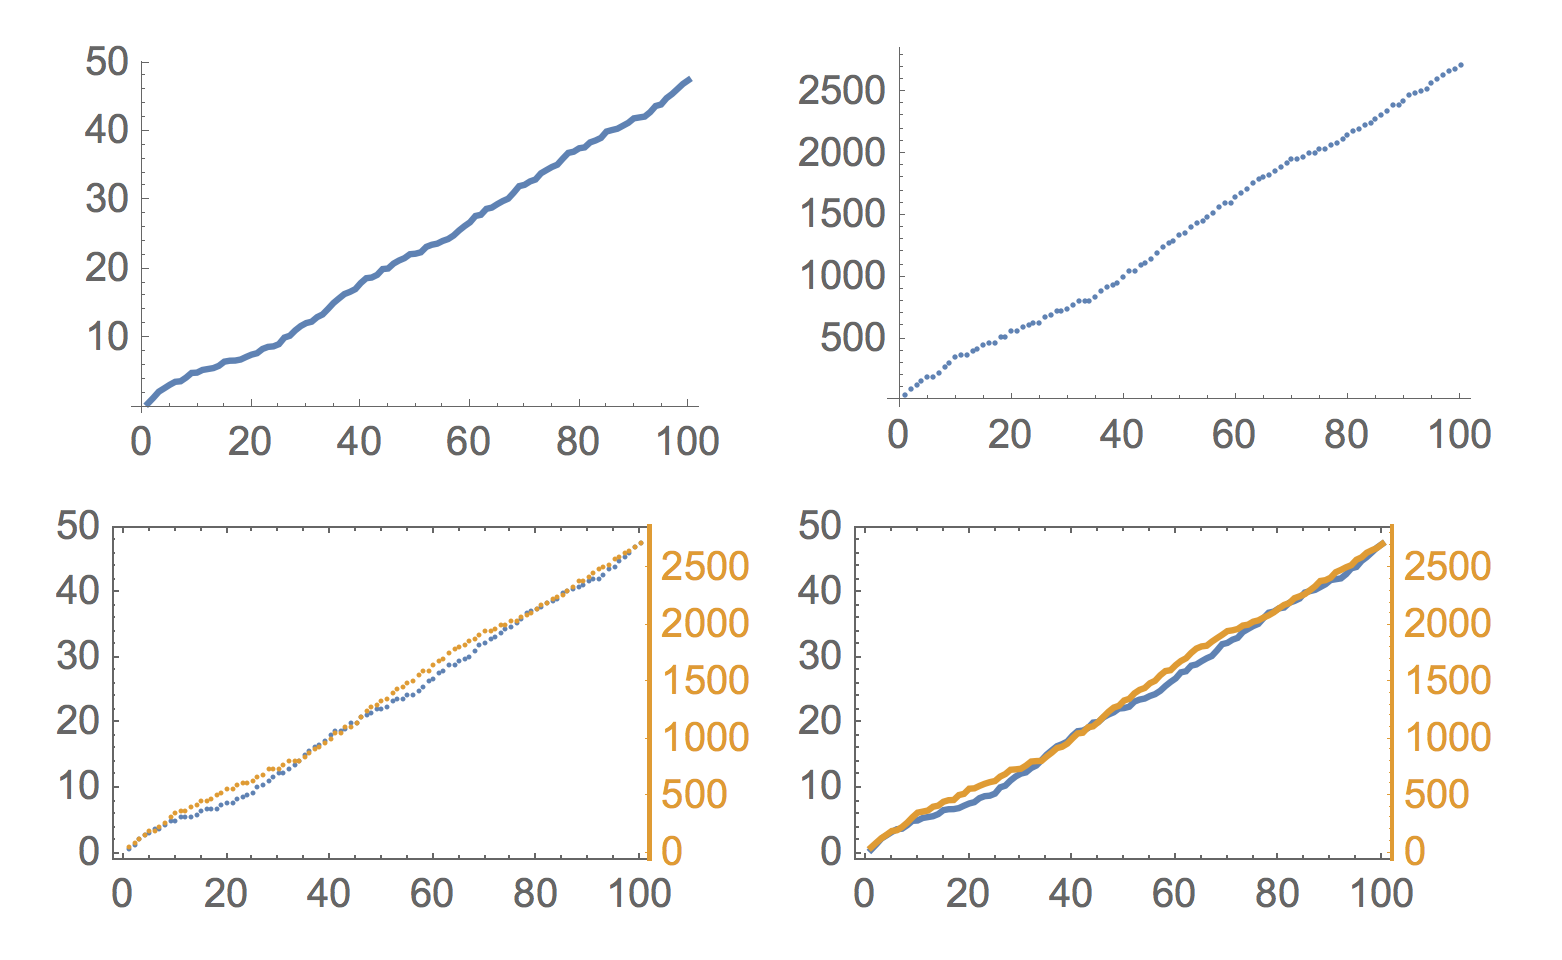
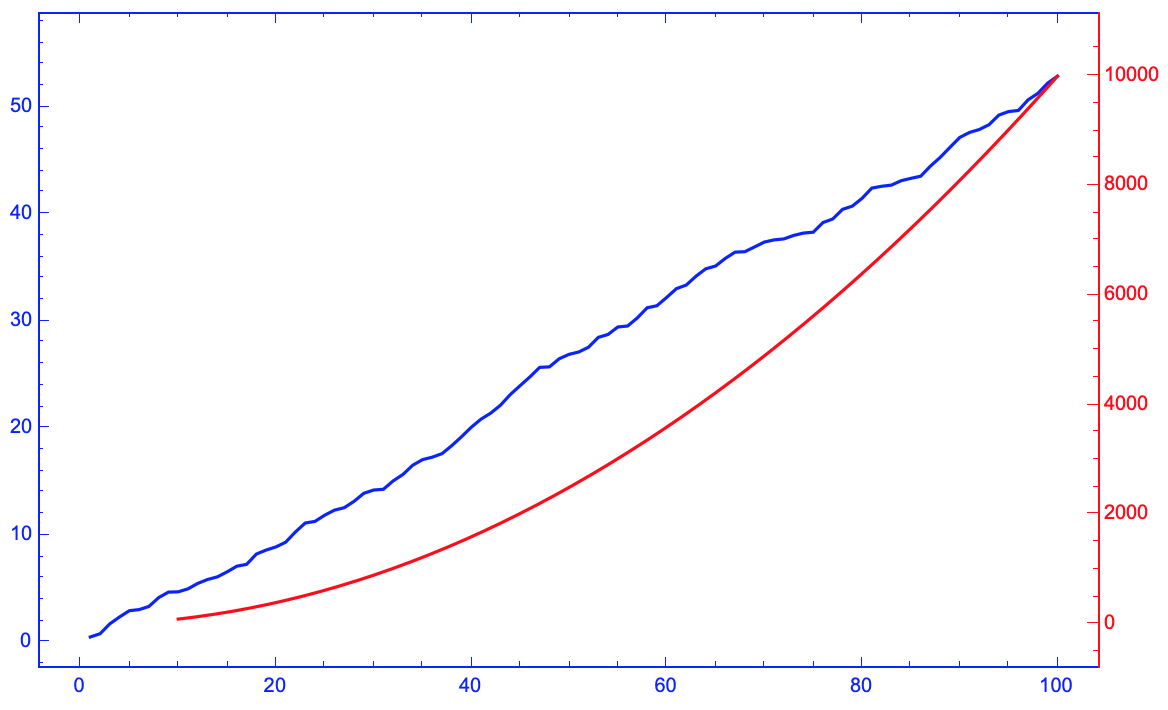


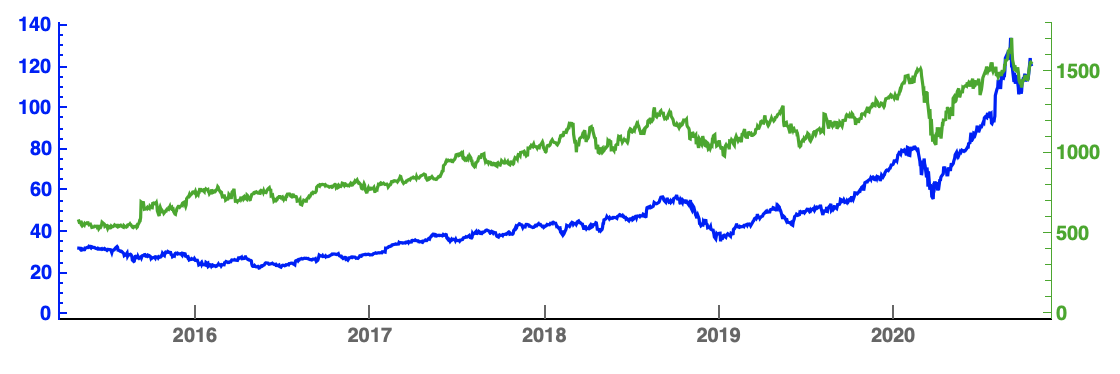
{fgraph, ggraph} = MapIndexed[ListPlot[#, Axes -> True, Joined -> True, PlotStyle -> ColorData[1][#2[[1]]]] &, {f, g}];. $\endgroup$