17
$\begingroup$

Possible Duplicate:
1 Plot, 2 Scale/Axis
Do I have to code each case of this Grid full of plots separately?

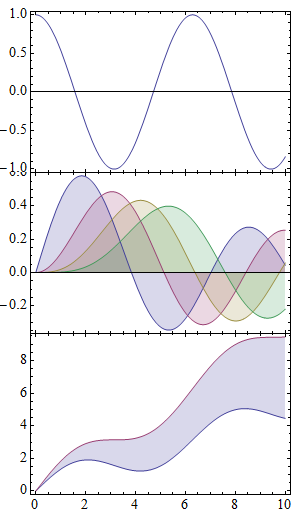
What's the most straightforward way to share an axis between two plots in Mathematica? Here's an example, showing the x-axis being shared between the 1st and 2nd, and the 2nd and 3rd plots: enter image description here Gridding plots in Mathematica is already a challenge, and the standard trick for doing so seems to be giving all the images being gridded the same ImagePadding option (as is done here). This doesn't really work well when trying to have two plots share the same axis, and typically requires much fine-tuning on my part to get things looking good, with problems involving superflous tick labels that are hidden beneath other plots, and clipping of the y-axis tick labels.
$\endgroup$
2
  • 1
    $\begingroup$ Isn't this a duplicate of mathematica.stackexchange.com/q/13373/5? In my answer, I show how to align two plots and also show the way to automatically calculate the padding necessary (it was left as an exercise to the OP, but if you follow the links, you should be able to use it without much effort). The only change you need to make is to set the bottom padding for the upper plots and the top padding for the lower plots to zero. $\endgroup$
    – rm -rf
    Commented Jan 4, 2013 at 23:12
  • $\begingroup$ @Hypnotoad certainly strongly related. Still the focus is slightly different, this one being as you say a matter of padding. $\endgroup$
    – Mr.Wizard
    Commented Jan 4, 2013 at 23:29

4 Answers 4

14
$\begingroup$

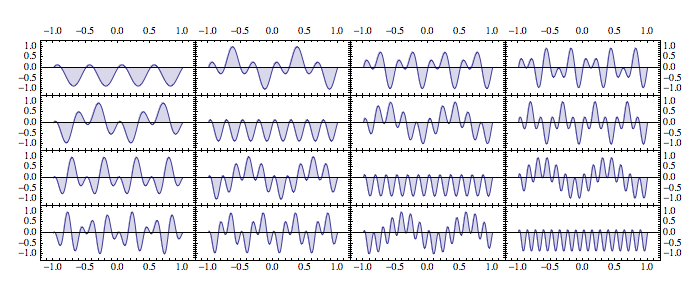
Using my linked answer to the duplicate question, you can make grids of plots with shared axis in any arrangement you wish, e.g.:

plots = Table[
   Plot[Cos[2 Pi m x + Pi/4] Sin[2 Pi n x], {x, -1, 1}, Frame -> True,
     Axes -> {True, False}, Filling -> Axis, FrameTicks -> All, 
    PlotRangePadding -> .2, PlotRange -> {-1.1, 1.1}], {m, 1, 4}, {n, 
    1, 4}];

plotGrid[plots, 700, 300]

plot grid

$\endgroup$
1
  • $\begingroup$ I must have missed that Q/A. It seems you already did the work on this one. I'll have to test it on v7 when I get the chance but it looks good! $\endgroup$
    – Mr.Wizard
    Commented Jan 5, 2013 at 6:56
11
$\begingroup$

I'm not going to claim that it's ideal, but it really doesn't take that much effort to stack a few plots using Column or Grid. I'm not in the mood to do it but it wouldn't be difficult to create a function to generate the right option values for a series of plots.

p1 = Plot[Cos[x], {x, 0, 10}, Frame -> True, 
   ImagePadding -> {{30, 10}, {0, 10}}, ImageSize -> 300];

p2 = Plot[Evaluate[Table[BesselJ[n, x], {n, 4}]], {x, 0, 10}, 
   Filling -> Axis, Frame -> True, ImagePadding -> {{30, 10}, {0, 0}},
    ImageSize -> 300];

p3 = Plot[{Sin[x] + x/2, Sin[x] + x}, {x, 0, 10}, 
   Filling -> {1 -> {2}}, Frame -> True, 
   ImagePadding -> {{30, 10}, {20, 0}}, ImageSize -> 300];

Column[{p1, p2, p3}, Spacings -> 0]

Mathematica graphics

The only option that is changing here is the value of ImagePadding, and it is simply in a first-middle-last order. The only obvious problem is the clipping of the label between the first and second plot.

$\endgroup$
3
  • $\begingroup$ I guess I should clarify that I have used a solution similar to this in the past, but there are two problems with it: First, the axis labels are there for the top two plots, they are just behind the other plots. To not have this, one has to specify custom tick labels for the x-axis. Second, as you mentioned, the y-axis labels are clipped by the other plots, which is not desirable. Avoiding this requires one again to specific custom y-axis marks for all three plots. This is all doable, but it's not elegant, I was hoping that someone would come up with a more general solution. $\endgroup$
    – Guillochon
    Commented Jan 4, 2013 at 23:25
  • 1
    $\begingroup$ @Guillochon Why is (1) a problem? As for (2) I'll try to fix that robustly later. It would be helpful if you would show what you've tried in your question. If this had been the starting point I would have likely refined it rather than merely recreating it. $\endgroup$
    – Mr.Wizard
    Commented Jan 4, 2013 at 23:31
  • $\begingroup$ #1 is a problem in cases where the plots have Background -> None, or when exporting the graphic to other formats, as the coordinates are usually not preserved perfectly. It also just makes the graphics file a bit larger than it should be. I apologize for not being more straightforward in the original question. $\endgroup$
    – Guillochon
    Commented Jan 4, 2013 at 23:41
3
$\begingroup$

This is a variant of Mr.Wizard's approach.

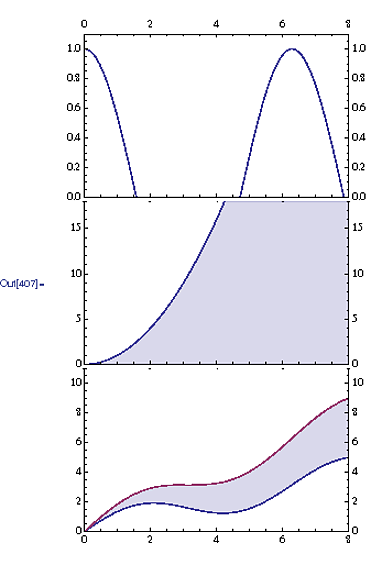
output

Notice the following:

  • p1 has a full frame; p2 and p3 do not display the top edge of the frame.
  • The third parameter of ImagePadding is set to 4 in p1 and p2. This allows the origin to be shown on the y-axis without showing the values on the x axis.
  • The PlotRanges of p2 and p3 were extended by 10% in order to avoid y values overwriting the origin of the plot just above.

Code

p1 = Plot[Cos[x], {x, 0, 8},
Frame -> True,
ImagePadding -> {{30, 30}, {4, 30}},
PlotRange -> {{0, 8}, {0, 1.1}},
Background -> None, ImageSize -> 300, FrameTicks -> All];

p2 = Plot[x^2, {x, 0, 8},
Frame -> {True, True, False, True},
ImagePadding -> {{30, 30}, {4, 0}},
PlotRange -> {{0, 8}, {0, 18}},
Filling -> Axis, FrameTicks -> All, Background -> None, ImageSize -> 300];

p3 = Plot[{Sin[x] + x/2, Sin[x] + x}, {x, 0, 8},
Frame -> {True, True, False, True},
ImagePadding -> {{30, 30}, {30, 0}},
PlotRange -> {{0, 8}, {0, 11}},
FrameTicks -> All, Background -> None, Filling -> {1 -> {2}}, ImageSize -> 300];

Column[{p1, p2, p3}, Spacings -> 0]

$\endgroup$
2
  • $\begingroup$ Apologies for the poor quality of the figure. (I haven't been able to use SE uploader since I moved to v. 9.) Also, the three vestiges of tickmarks at the upper part of p2 and p3 do not show up on my screen. They appear to arise during the export of the pdf. I'm hopeful this can be eliminated by some tweaking. $\endgroup$
    – DavidC
    Commented Jan 5, 2013 at 2:35
  • $\begingroup$ In version 8.0.4 this code works perfect. I do not see any vestiges of tickmarks after exporting to PDF, PNG and JPG via the FrontEnd. +1 $\endgroup$ Commented Jan 5, 2013 at 5:53
0
$\begingroup$

An alternative, if you don't mind add-ons, is Mark Caprio's LevelScheme. I'm not near an appropriate machine at the moment to provide code samples, but there are extensive, easy to follow examples provided with the package.

$\endgroup$
1
  • $\begingroup$ This or this might be a starting point for those interested in using LevelScheme $\endgroup$
    – rm -rf
    Commented Jan 6, 2013 at 1:11

Not the answer you're looking for? Browse other questions tagged or ask your own question.