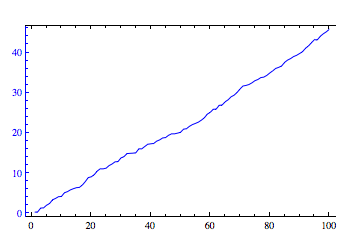
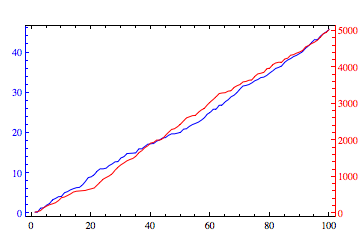
This can be done with Overlay if the ImagePadding and the horizontal range for each plot is the same. For example,
plot1 = ListLinePlot[
    Accumulate[RandomReal[{0, 1}, {100}]],
    PlotStyle -> Blue,
    ImagePadding -> 25,
    Frame -> {True, True, True, False},
    FrameStyle -> {Automatic, Blue, Automatic, Automatic}
]

plot2 = ListLinePlot[
    Accumulate[RandomReal[{0, 100}, {100}]],
    PlotStyle -> Red,
    ImagePadding -> 25,
    Axes -> False,
    Frame -> {False, False, False, True},
    FrameTicks -> {{None, NoneAll}, {None, AllNone}},
    FrameStyle -> {Automatic, Automatic, Automatic, Red}
]

Overlay[{plot1, plot2}]

Edit: Cleared up which axis is which using FrameStyle.
