4
$\begingroup$

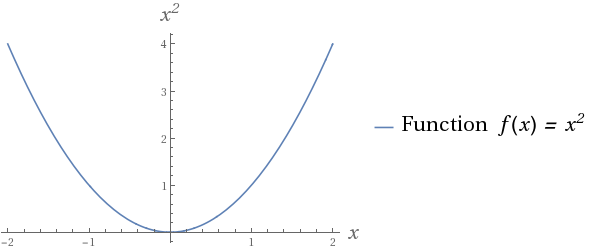
I use the following command to export plots to PDF which I then use in latex:

plot = Plot[x^2, {x, -2, 2}, AxesLabel -> {x, x^2}, 
       PlotLegends -> {"Function f(x) = x^2"}]
Export[NotebookDirectory[] <> "SimplePlot.pdf", plot]
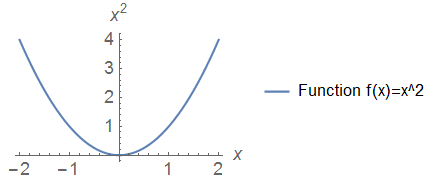
enter image description here

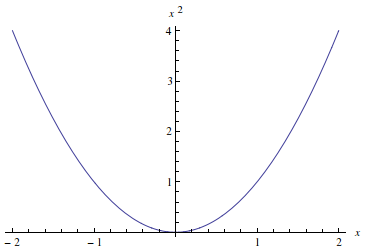
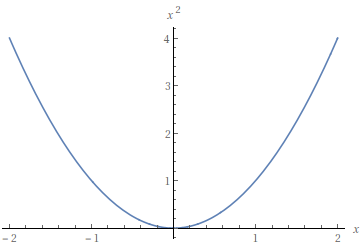
Now the "problem" is that the font of $x$, $x^2$ and $f(x)=x^2$ is not at all similar to the standard font of latex. I found that the command TraditionalForm produces output with a font that seems to fit latex much better:
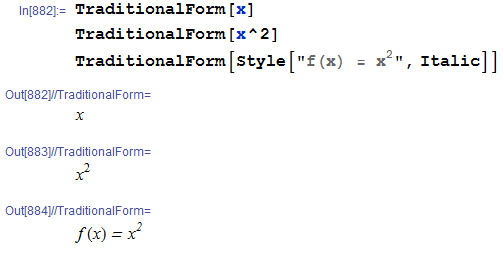
enter image description here

But simply putting AxesLabel -> {TraditionalForm[x], TraditionalForm[x^2]} for example does not change the plot's font. So how can I change the font in my plot to the one that TraditionalForm offers? And no, I do not want to change the font in latex. ;)

$\endgroup$
10
  • $\begingroup$ The url's for your images don't have public access $\endgroup$ Commented Sep 3, 2014 at 16:05
  • $\begingroup$ That's twice the same link ... $\endgroup$ Commented Sep 3, 2014 at 16:13
  • $\begingroup$ My location has blocked uploads on SE, so I had to use google. The direct links to the images are docs.google.com/file/d/0B8kIki5yrvFbZnREdVg0TlZPeTQ/edit?pli=1 and docs.google.com/file/d/0B8kIki5yrvFbYTNGajBadDVWU0k/edit?pli=1. I am very sorry about the inconvenience. $\endgroup$
    – Phil-ZXX
    Commented Sep 3, 2014 at 16:15
  • $\begingroup$ Does PlotTheme->"ItalicLabels" give something close to what you need? $\endgroup$
    – kglr
    Commented Sep 3, 2014 at 16:51
  • $\begingroup$ @wuyingddg solution works as expected on 10.0 for Mac OS X x86 (64-bit) (June 29, 2014). If you like to change the plot's font you can add LabelStyle -> {FontFamily -> "Times", 14, GrayLevel[0]}. As long as the Font is installed on your System, the Font will be embedded. $\endgroup$
    – user9660
    Commented Sep 3, 2014 at 16:58

3 Answers 3

4
$\begingroup$
plot = Plot[x^2, {x, -2, 2},  AxesLabel -> {Style[x, 20], Style[x^2, 20]}, 
     PlotTheme->"ItalicLabels",TicksStyle->Plain,
     PlotLegends -> {Row[{Style["Function  ",20,FontSlant-> "Plain",FontFamily->"Times"], 
        Style[HoldForm[ f[x]  =   x^2],20,FontSlant->"Oblique",FontFamily->"Times"]}] }]

enter image description here

Or, instead of using PlotTheme->"ItalicLabels" you can directly use the option settings for LabelStyle and TickStyle as follows

plot = Plot[x^2, {x, -2, 2},   AxesLabel -> {x,  x^2},
    LabelStyle (* or BaseStyle *) ->
          Directive[FontFamily->Times,FontSlant->"Oblique",FontSize->20],
    TicksStyle->Directive[FontSize->14,FontSlant->Plain],
    PlotLegends -> {Row[{Style["Function  ",FontSlant-> "Plain",FontFamily->"Times"], 
        Style[HoldForm[ f[x]  =   x^2],FontSlant->"Oblique",FontFamily->"Times"]}] }]

to get the same picture as above.

To get the settings for the theme "ItalicLabels" use

Charting`ResolvePlotTheme["ItalicLabels", Plot]

enter image description here

See also: this Q/A and this one

$\endgroup$
4
  • $\begingroup$ If we write Plot[x^2,{x,-2,2},AxesLabel->{Style[x,20],Style[x^2,20]},PlotLegends->{Style[HoldForm[Function f[x]=x^2],20]},LabelStyle->{FontFamily->"Times"}], then = is not tilted. $\endgroup$
    – Phil-ZXX
    Commented Sep 3, 2014 at 17:52
  • $\begingroup$ @Tom, it seems that we need to also add FontSlant->"Oblique"... $\endgroup$
    – kglr
    Commented Sep 3, 2014 at 17:58
  • $\begingroup$ This is just nitpicking, but why do you add Oblique? This is exactly what makes the equal sign = crooked, which one would probably want to avoid. $\endgroup$
    – Phil-ZXX
    Commented Sep 3, 2014 at 18:27
  • $\begingroup$ Oh ... I thought you wanted the = sign look slanted:) $\endgroup$
    – kglr
    Commented Sep 3, 2014 at 18:41
2
$\begingroup$

Mathematica 9 use TraditionalForm by default

Plot[x^2, {x, -2, 2}, AxesLabel -> {x, x^2}]

enter image description here

Mathematica 10 also use TraditionalForm, but fonts are different. So we have to change fonts back

Plot[x^2, {x, -2, 2}, AxesLabel -> {x, x^2}, AxesStyle -> FontFamily -> "Times"]

enter image description here

$\endgroup$
1
$\begingroup$

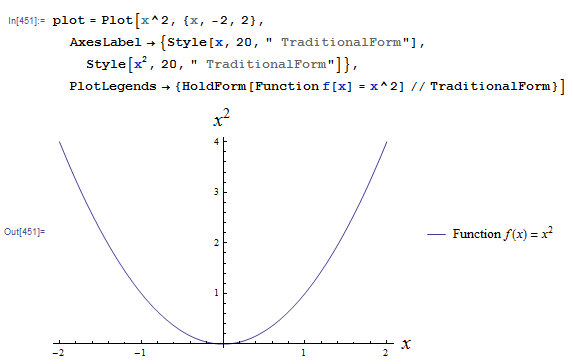
The function Style and HoldForm may be helpful

plot = Plot[x^2, {x, -2, 2}, 
  AxesLabel -> {Style[x, 20, " TraditionalForm"], 
    Style[x^2, 20, " TraditionalForm"]}, 
  PlotLegends -> {HoldForm[Function f[x] = x^2] // TraditionalForm}]

f(x) should be f[x] so that it can be convert into TraditionalForm

enter image description here

$\endgroup$
1
  • $\begingroup$ This only seems to work in Mathematica 9, but I am using version 10, in which your example (unfortunately) gives the same output as my screenshot above. :/ $\endgroup$
    – Phil-ZXX
    Commented Sep 3, 2014 at 16:38

Your Answer

By clicking “Post Your Answer”, you agree to our terms of service and acknowledge you have read our privacy policy.

Not the answer you're looking for? Browse other questions tagged or ask your own question.