I am having difficulty figuring out how to plot to projective space. Suppose I have a region which I have plotted such as:
RegionPlot[2 <= x <= 5 && 2 <= y <= 5, {x, -5, 10}, {y, -5, 10}]
How would I convert this to the projective plane, i.e. it would require transforming the plot into homogenous coordinates and then mapping it onto a sphere...
Similarly, with a 1 dimensional region, such as if I have $2 \le x \le 5$, how would I plot that onto the projective line which is a circle?
So for example 
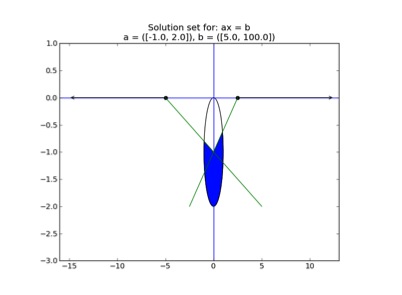
Is a solution in one dimensions to the interval equation [-1,2]x = [5,100].
The solution to this is $(-\infty, -5] \cup [\frac{5}{2}, \infty)$. These intervals are denoted on the real axis as the bold lines. I want to map them onto that circle and shade the regions below the lines.
I have found the following http://demonstrations.wolfram.com/HomogeneousCoordinatesAndTheProjectivePlane/
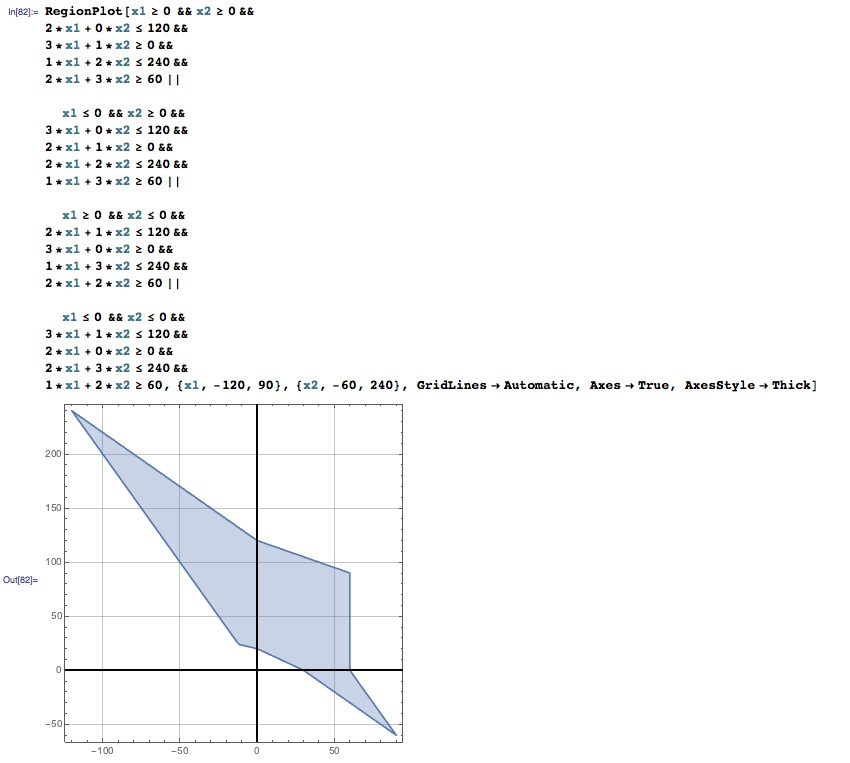
Here is an example of a 2D region I plotted:

Some other systems I plot aren't bounded and hence tend to infinity on both axes hence why I would like to be able to plot these to a projective plane so that I can represent infinity.
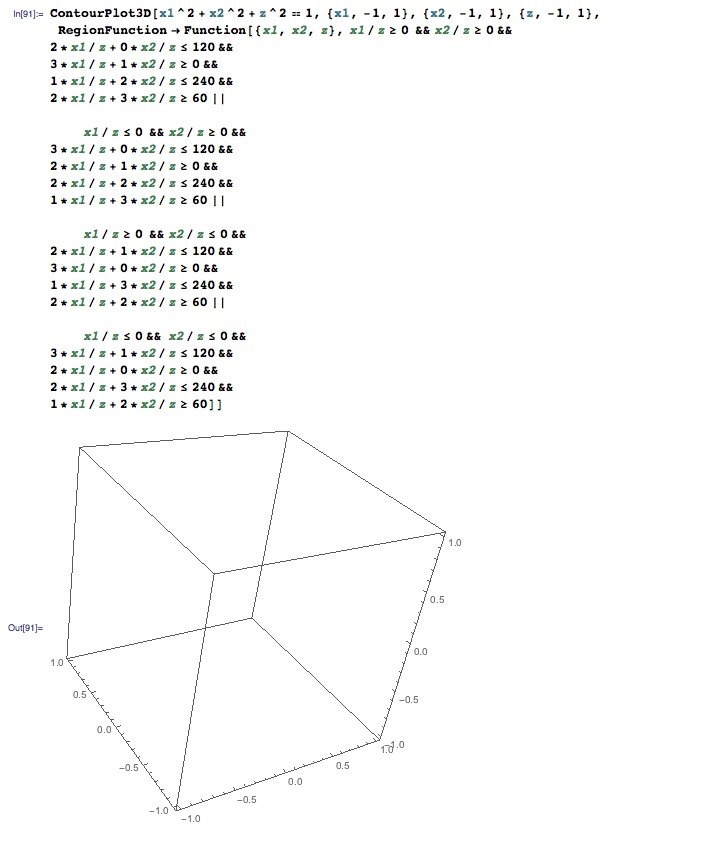
I tried doing this with the function provided by the kind gentlemen below:

As you can see the plot is empty, but it definitely shouldn't be seeing as the plot in 2D above it has quite a large region filled in
