11
$\begingroup$

Bug introduced in 10.0.1 or 10.0.2 and fixed in 10.1.0


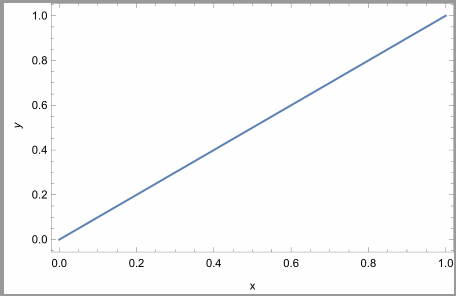
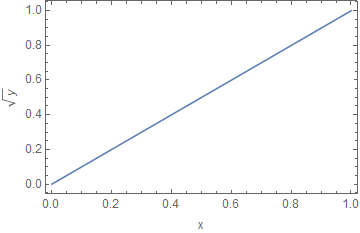
In version 10, if we plot with Sqrt in y-axis, and export to PDF, the square root disappears in the PDF file.

p = Plot[x, {x, 0, 1}, Frame -> True, 
  FrameLabel -> {"x", "\!\(\*SqrtBox[\(y\)]\)"}]
enter image description here

Export["test.pdf", p];

enter image description here

This does not happen in version 9.

$\endgroup$
13
  • $\begingroup$ I can reproduce this on OS X, v 10.0.0. Can you report this problem to support at wolfram.com? $\endgroup$
    – Szabolcs
    Commented Jul 25, 2014 at 21:16
  • $\begingroup$ @Szabolcs Thanks for reproducing it. I reported a bug. $\endgroup$
    – Yi Wang
    Commented Jul 25, 2014 at 21:55
  • $\begingroup$ Present in 10.0.1 as well. $\endgroup$ Commented Sep 17, 2014 at 15:16
  • 3
    $\begingroup$ Confirm it works in 9 but not in 10.0.2 (OS X 10.10.1). Incidentally if you want to use boxes in your labels it might be easier to do this {DisplayForm@SqrtBox["x"], DisplayForm@SqrtBox["y"]}. Related: mathematica.stackexchange.com/questions/69242/… $\endgroup$ Commented Dec 18, 2014 at 6:50
  • 2
    $\begingroup$ Fixed in 10.1.0 but now I use MaTeX anyway ... motivated precisely by these types of problems. $\endgroup$
    – Szabolcs
    Commented Apr 2, 2015 at 2:54

2 Answers 2

8
$\begingroup$

Looks like a bug. Stupid workaround:

Export["t:\\test.pdf", ImportString@ExportString[p, "EPS"]]

At the very least, there's a good chance that this would output reasonable vector graphics.

Or,

p = Plot[x, {x, 0, 1}, Frame -> True, FrameLabel -> {x, Sqrt[y]}]

The latter is what I usually do, anyway.

$\endgroup$
1
  • $\begingroup$ Thanks a lot! Very clever workaround :) I actually also tried the second method. However, my actual y-axis is quite complicated and I don't want Mathematica to automatically format the equation for me. So a string is preferred. $\endgroup$
    – Yi Wang
    Commented Jul 25, 2014 at 21:58
4
$\begingroup$

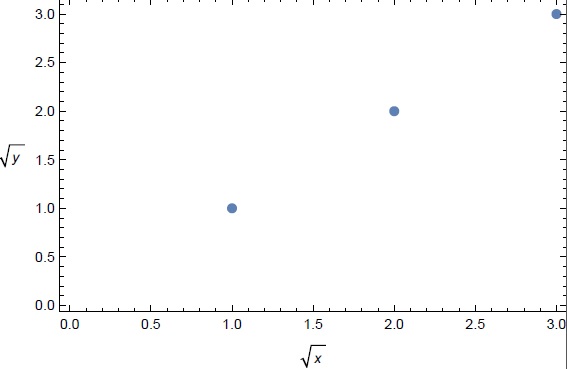
The problem seems to be when the label is rotated. Check this:

Export["test.pdf", 
 ListPlot[{1, 2, 3}, Joined -> False, Frame -> True, 
  FrameLabel -> {Rotate["\!\(\*SqrtBox[\(x\)]\)", \[Pi]/2], 
    "\!\(\*SqrtBox[\(y\)]\)"}]]

however if you accept unrotated label, you can use:

Export["test.pdf", 
 ListPlot[{1, 2, 3}, Joined -> False, Frame -> True, 
  FrameLabel -> {"\!\(\*SqrtBox[\(x\)]\)", "\!\(\*SqrtBox[\(y\)]\)"}, 
  RotateLabel -> False]]

enter image description here

$\endgroup$

Your Answer

By clicking “Post Your Answer”, you agree to our terms of service and acknowledge you have read our privacy policy.

Not the answer you're looking for? Browse other questions tagged or ask your own question.