13
$\begingroup$

is there any built in function that can be used to find maximum or minimum of implicit functions?

For example, if we have the equation $$x^2 + y^2 = (2 x^2 + 2 y^2 - x)^2,$$ then we can visualize the set of all $(x,y)$ making the equation true using ContourPlot.

ContourPlot[
 x^2 + y^2 == (2 x^2 + 2 y^2 - x)^2, {x, -1, 2}, {y, -1, 1}, 
 AspectRatio -> Automatic]
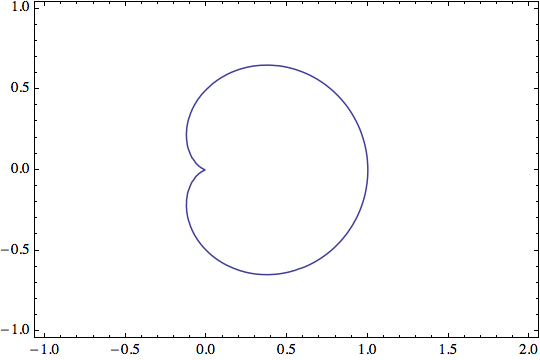
enter image description here

Clearly, $y$ is not a function of $x$ but, in the neighborhood of most points on the graph, a function is implied, i.e. $y$ is implicitly a function of $x$. Is there any built in way to find the maximum and/or minimum value of this function (like what we have for the explicit functions)?

$\endgroup$
2
  • $\begingroup$ @Algohi - I've edited your question. Please make sure that I've retained your intended meaning. $\endgroup$ Commented Jun 27, 2014 at 11:03
  • $\begingroup$ @MarkMcClure yes you have. thank you. $\endgroup$ Commented Jun 27, 2014 at 11:34

9 Answers 9

20
$\begingroup$
Maximize[{y, x^2 + y^2 == (2 x^2 + 2 y^2 - x)^2}, {x, y}]
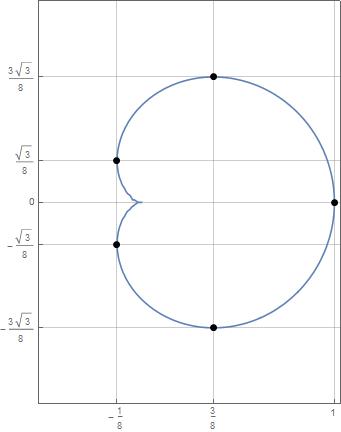
{(3 Sqrt[3])/8, {x -> 3/8, y -> (3 Sqrt[3])/8}}
$\endgroup$
2
13
$\begingroup$

You could use Lagrange multipliers to maximize $f(x,y)=y$ subject to the constraint that $$g(x,y) = x^2 + y^2 - (2 x^2 + 2 y^2 - x)^2 = 0.$$

f[x_, y_] = y;
g[x_, y_] = x^2 + y^2 - (2 x^2 + 2 y^2 - x)^2;
eqs = {D[f[x, y], x] == lambda*D[g[x, y], x],
  D[f[x, y], y] == lambda*D[g[x, y], y], g[x, y] == 0};
Solve[eqs, {x, y, lambda}] // InputForm

(* Out: {
  {x -> 3/8, y -> (-3*Sqrt[3])/8, lambda -> 2/(3*Sqrt[3])}, 
  {x -> 3/8, y -> (3*Sqrt[3])/8, lambda -> -2/(3*Sqrt[3])}}
*)

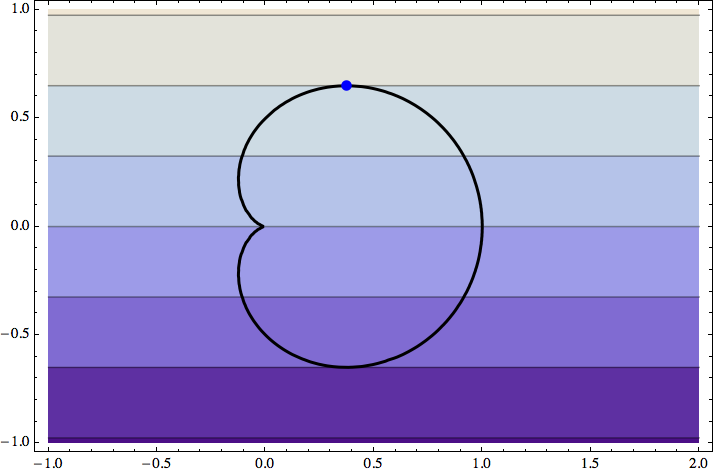
The maximum value of $y$ is $3\sqrt{3}/8 \approx 0.6495$. Of course, this should occur where the proper contour of $y$ is tangent to the restraint curve. You can visualize the situation like so.

contourPic = ContourPlot[y, {x, -1, 2}, {y, -1, 1},
  Contours -> Range[-2, 2, 1/2]*3 Sqrt[3]/8];
restraintPic  = ContourPlot[x^2 + y^2 - (2 x^2 + 2 y^2 - x)^2 == 0, 
  {x, -1, 2}, {y, -1, 1}, ContourStyle -> {Thick, Black}];
Show[{contourPic, restraintPic}, AspectRatio -> Automatic,
  Epilog -> {PointSize[Large], Blue, Point[{3/8, 3 Sqrt[3]/8}]}]

enter image description here

$\endgroup$
2
  • $\begingroup$ Very nice. Even better if you would also show the maximum in x-direction (1 or near 1) and the minima. $\endgroup$
    – eldo
    Commented Jun 27, 2014 at 10:56
  • $\begingroup$ @Mark McClure, thanks for the solution. I was looking from some built in function but thanks for suggesting Lagrange multipliers. $\endgroup$ Commented Jun 27, 2014 at 11:33
9
$\begingroup$

In version 10,

RegionBounds@ImplicitRegion[x^2 + y^2 == (2 x^2 + 2 y^2 - x)^2, {x, y}]

(* {{-(1/8), 1}, {-((3 Sqrt[3])/8), (3 Sqrt[3])/8}} *)
$\endgroup$
6
$\begingroup$

This implicit equation is simple enough to be converted to explicit equations

eqn = x^2 + y^2 == (2 x^2 + 2 y^2 - x)^2;

yExpr = (y /. Solve[eqn, y]);

yMax = SortBy[Maximize[#, x] & /@ yExpr, N[First[#]] &][[-1, 1]];

yMin = SortBy[Minimize[#, x] & /@ yExpr, N[First[#]] &][[1, 1]];

xExpr = (x /. Solve[{eqn, yMin < y < yMax}, x, Reals]) // 
   Simplify[#, yMin < y < yMax] &;

xMax = SortBy[Maximize[#, y] & /@ xExpr // Quiet, N[First[#]] &][[-1, 1]];

xMin = SortBy[Minimize[#, y] & /@ xExpr, N[First[#]] &][[1, 1]];

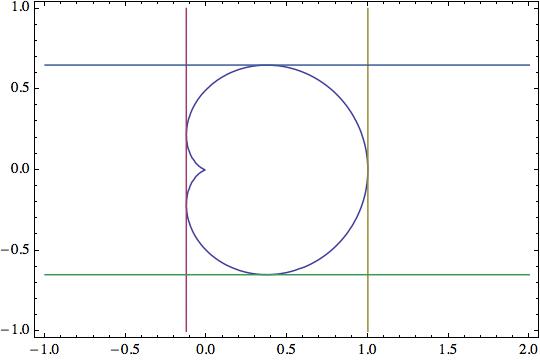
ContourPlot[
 Evaluate[{eqn, x == xMin, x == xMax, y == yMin, y == yMax}],
 {x, -1, 2}, {y, -1, 1},
 AspectRatio -> Automatic]

enter image description here

$\endgroup$
1
  • $\begingroup$ for this equation yes. but I was asking in general. thanks for the answer. $\endgroup$ Commented Jun 27, 2014 at 12:28
5
$\begingroup$

Also just for fun (in case you don't like to solve equations):

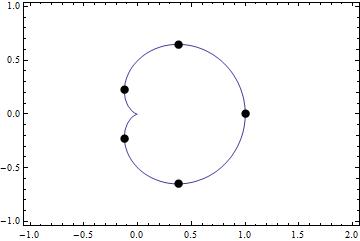
cp = ContourPlot[x^2 + y^2 == (2 x^2 + 2 y^2 - x)^2, {x, -1, 2}, {y, -1, 1}, 
  AspectRatio -> Automatic];

x = Cases[cp, {_Real, _Real}, Infinity];

points = Point /@ {Take[SortBy[x, First], 2], First@SortBy[x, Last],
    Last@SortBy[x, First], Last@SortBy[x, Last]};

Show[cp, Graphics[{[email protected], points}]]

enter image description here

$\endgroup$
3
$\begingroup$

I post this just for fun. It does not address the general question of maximizing implicit function but Kuba has shown how to maximize y subject to constraint f(x,y).

The problem can (with a small amount of manipulation) converted to explicit polar form: $r=0.5(cos\theta+1)$. Using this:

rho[t_] := (Cos[t] + 1)/2;
ycrit = Solve[D[Cos[u] Sin[u] + Sin[u], u] == 0, u]
xcrit = Solve[D[Cos[u]^2 + Cos[u], u] == 0, u]
pol = PolarPlot[0.5 (Cos[t] + 1), {t, 0, 2 Pi}, 
  MeshFunctions -> {#3 &, #3 &}, 
  Mesh -> {{Pi/3, Pi, 2 Pi - Pi/3}, {0, 2 Pi/3, 2 Pi - 2 Pi/3}}, 
  MeshStyle -> {{Red, PointSize[0.02]}, {Blue, PointSize[0.02]}}]
max = rho[#] {Cos[#], Sin[#]} &[Pi/3]

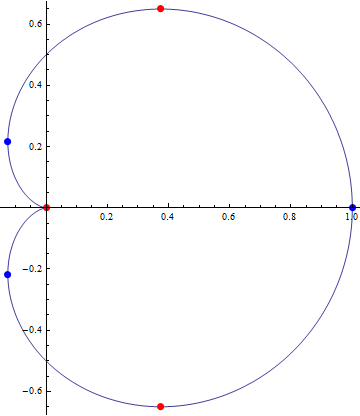
The y critical points are the maximum, the cusp and minmum:

{{u -> ConditionalExpression[-([Pi]/3) + 2 [Pi] C1, C1 [Element] Integers]}, {u -> ConditionalExpression[[Pi]/3 + 2 [Pi] C1, C1 [Element] Integers]}, {u -> ConditionalExpression[[Pi] + 2 [Pi] C1, C1 [Element] Integers]}}

The x critical points: {{u -> ConditionalExpression[2 [Pi] C1, C1 [Element] Integers]}, {u -> ConditionalExpression[-((2 [Pi])/3) + 2 [Pi] C1, C1 [Element] Integers]}, {u -> ConditionalExpression[(2 [Pi])/3 + 2 [Pi] C1, C1 [Element] Integers]}, {u -> ConditionalExpression[[Pi] + 2 [Pi] C1, C1 [Element] Integers]}}

The visualization:

enter image description here

The maximum: enter image description here

$\endgroup$
2
$\begingroup$
Reduce[x^2+y^2==(2 x^2+2 y^2-x)^2,{y},{x},Reals]

-((3 Sqrt[3])/8) <= y <= (3 Sqrt[3])/8

$\endgroup$
1
$\begingroup$

You function is

f = x^2 + y^2 - (2 x^2 + 2 y^2 - x)^2;

Then call function Maximize

Maximize[f, {x, y}]
(*{27/64,{x->3/4,y->0}}*)

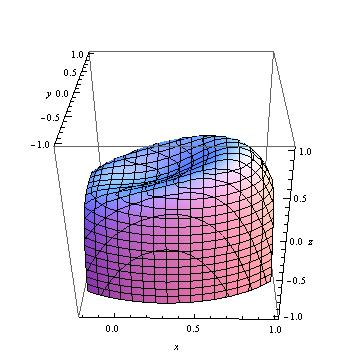
And here is plot of you function

enter image description here

$\endgroup$
1
  • 1
    $\begingroup$ That is different than what I meant. you have changed the function from 2D to 3D which is not the case. $\endgroup$ Commented Jun 27, 2014 at 10:29
0
$\begingroup$
f = x^2 + y^2 - (2 x^2 + 2 y^2 - x)^2;

points =
  Catenate[{x, y} /. 
    MapThread[Solve[{f == 0, -D[f, #1]/D[f, #2] == 0}, {x, y}, Reals] &, {{x, y}, {y, x}}]]

enter image description here

grid = Union /@ Transpose@points;

ContourPlot[f == 0, {x, -1/2, 1}, {y, -1, 1},
 AspectRatio -> Automatic,
 Epilog -> {PointSize@Large, Point@points},
 FrameTicks -> Join[grid, {None, None}],
 GridLines -> grid]

enter image description here

$\endgroup$

Your Answer

By clicking “Post Your Answer”, you agree to our terms of service and acknowledge you have read our privacy policy.

Not the answer you're looking for? Browse other questions tagged or ask your own question.