With
ListLinePlot [
 {13, 6, 2, 2, 3},
 AxesOrigin -> {1, 0},Background -> [email protected],
 GridLines -> None, ImageSize -> 300,
 ImageMargins -> 0, PlotLabel -> "XYZ",
 Filling -> Bottom, PlotMarkers -> Automatic, Frame -> True]
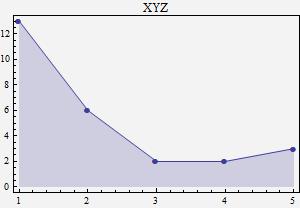
I obtained:

I would like to move the
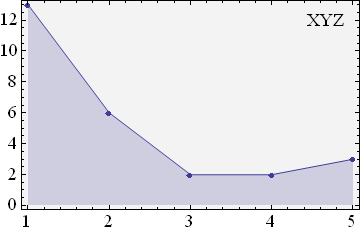
PlotLabel"XYZ"into the upperright corner of the plotting area.The
Background-option also colors the background of the axes-values and the label, but I only want to color (like in Excel) the actual plotting-area.
I could think of some complicated ways to achieve this, but would like to see a short and handy solution.
Thanks in advance for your help.


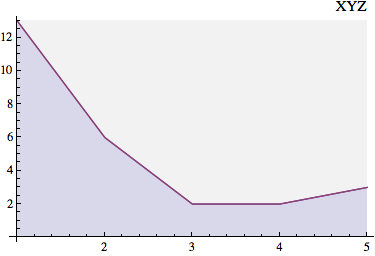
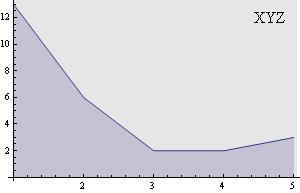
data = {13, 6, 2, 2, 3}; background = RegionPlot[x y <= Length[data] Max[data], {x, 1, Length[data]}, {y, 0, Max[data]}, PlotStyle -> [email protected]];2. Display it together with your plot (implementing Öskå's suggestion):Labeled[ Show[background, ListLinePlot[data,AxesOrigin -> {1, 0},GridLines -> None, ImageSize -> 300, ImageMargins -> 0]],"XYZ", {{Top, Right}}]. $\endgroup$