5
$\begingroup$

With

ListLinePlot [
 {13, 6, 2, 2, 3},
 AxesOrigin -> {1, 0},Background -> [email protected],
 GridLines -> None, ImageSize -> 300,
 ImageMargins -> 0, PlotLabel -> "XYZ",
 Filling -> Bottom, PlotMarkers -> Automatic, Frame -> True]

I obtained:
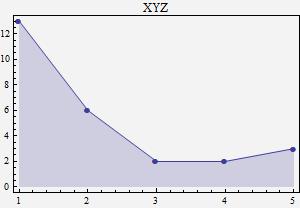
enter image description here

  1. I would like to move the PlotLabel "XYZ" into the upperright corner of the plotting area.

  2. The Background-option also colors the background of the axes-values and the label, but I only want to color (like in Excel) the actual plotting-area.

I could think of some complicated ways to achieve this, but would like to see a short and handy solution.

Thanks in advance for your help.

$\endgroup$
2
  • $\begingroup$ This is not elegant but it works...: 1. Generate your background: data = {13, 6, 2, 2, 3}; background = RegionPlot[x y <= Length[data] Max[data], {x, 1, Length[data]}, {y, 0, Max[data]}, PlotStyle -> [email protected]]; 2. Display it together with your plot (implementing Öskå's suggestion): Labeled[ Show[background, ListLinePlot[data,AxesOrigin -> {1, 0},GridLines -> None, ImageSize -> 300, ImageMargins -> 0]],"XYZ", {{Top, Right}}]. $\endgroup$
    – Boson
    Commented May 23, 2014 at 12:37
  • 2
    $\begingroup$ One of the two questions here is a duplicate of: Changing the background color of a framed plot. $\endgroup$
    – Jens
    Commented May 23, 2014 at 14:39

3 Answers 3

10
$\begingroup$

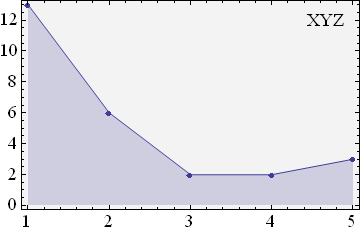
You can put there a Rectangle ;)

ListLinePlot[{13, 6, 2, 2, 3}, Axes -> False, Frame -> True, PlotMarkers -> Automatic,
                               Filling -> Bottom, BaseStyle -> 18,
             Prolog -> {[email protected], Scaled /@ Rectangle[{0, 0}, {1, 1}]},
             Epilog -> {Inset["XYZ", Scaled[{.9, .9}]]}]

enter image description here

$\endgroup$
6
  • 1
    $\begingroup$ I was having this :( You are way too fast $\endgroup$
    – Öskå
    Commented May 23, 2014 at 12:38
  • $\begingroup$ I like that solution. (It is better than mine.) $\endgroup$
    – Boson
    Commented May 23, 2014 at 12:39
  • $\begingroup$ @Öskå@Kuba - ALMOST what I was looking for. ALMOST, because I would like to see "XYZ" inside the plotting area. Thank you so far. And yes, answers here are very fast :) $\endgroup$
    – eldo
    Commented May 23, 2014 at 12:45
  • 1
    $\begingroup$ @Kuba I need AxesOrigin -> {1, 0}, to make it look better, maybe it's just v8. Picture without. $\endgroup$
    – Öskå
    Commented May 23, 2014 at 12:53
  • $\begingroup$ Or you could add it in your answer, I guess it's not shadowing anything in v9. $\endgroup$
    – Öskå
    Commented May 23, 2014 at 12:57
4
$\begingroup$

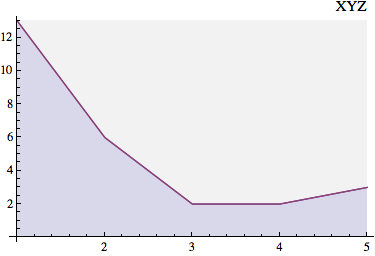
You can get the background effect you want by double plotting your data. The plot label can be shifted using Row and Spacer.

ListLinePlot[{{13, 6, 2, 2, 3}, {13, 6, 2, 2, 3}},
  AxesOrigin -> {1, 0},
  Filling -> {1 -> Bottom, 2 -> Top},
  FillingStyle -> {2 -> GrayLevel @ 0.95},
  ImageSize -> 300,
  ImageMargins -> 0,
  PlotLabel -> Row[{"", "XYZ"}, Spacer[250]]]

plot

$\endgroup$
3
$\begingroup$

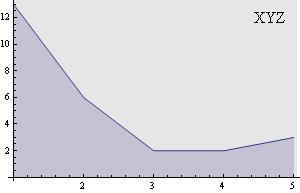
Try this:

    Show[{
  ListLinePlot[{13, 6, 2, 2, 3}, AxesOrigin -> {1, 0}, 
   Filling -> Bottom,
   GridLines -> None, ImageSize -> 300, ImageMargins -> 0, 
   Epilog -> Inset[Style["XYZ", 16], Scaled[{0.9, 0.9}]]],
  Graphics[{Opacity[0.1], Rectangle[{1, 14.5}, {5.05, 0}]}]
  }]

Looking as follows: enter image description here

If you need the same color below and above the line, remove the option Filling.

$\endgroup$
4
  • $\begingroup$ @Kuba - Thanks, Exactly what I needed $\endgroup$
    – eldo
    Commented May 23, 2014 at 12:53
  • $\begingroup$ The fact that the rectangle is dependent on the data (Rectangle[{1, 14.5}, {5.05, 0}]) is quite bad IMO. $\endgroup$
    – Öskå
    Commented May 23, 2014 at 12:55
  • $\begingroup$ @Öskå - Thanks for editing (I had preset options early in the program) - I can live with Kuba's solution because the program "knows" the rectangle-values. $\endgroup$
    – eldo
    Commented May 23, 2014 at 13:01
  • $\begingroup$ @ Öskå Yes, It is unsatisfactory. It is fast to do though. You just put the stuff inside manipulate and get these numbers within seconds. $\endgroup$ Commented May 23, 2014 at 15:01

Not the answer you're looking for? Browse other questions tagged or ask your own question.