I want to apply the following color rules to a large table of numbers. I have extracted a part of the table to use as an example.
I would like to assign 5 different colors to 5 different ranges of numbers in the plot. I have attempted to use ColorRules.
Additionally I would not like any of the number sets to overlap. IE the intersection of the sets should be zero.
The five colors I would like to use as specified by their RGB values are
rgb(215,25,28), rgb(253,174,97), rgb(255,255,191), rgb(166,217,106), rgb(26,150,65)
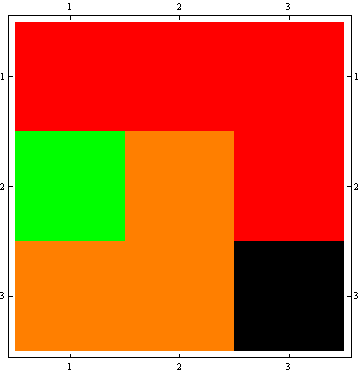
And the colors can be visualized here.
I have been trying to use ColorRules but I have not been successful. I would like to specify the ranges in a substituion rule like so:
subs = {r1, r2, r3, r4, r5}
then I would like any number in range 1 to get the first color value in the list. Any number in range 2 should get the second color in the list etc.
MatrixPlot[data]
I am trying something like this:
MatrixPlot[data, ColorRules -> {colors we assign} /. subs]


data = {{-3.24293,-1.47187,-1.69071,-6.51991,-12.991},{-2.92423,-1.61127,-1.48652,-6.57345,-4.54179},
 {-2.81276,-1.60509,-1.42055,-5.76192,-5.01714},{-2.69414,-1.7745,-1.16451,-10.9609,-5.70199},{-1.55186,-1.90981,-2.51796,-9.72864,-5.1199},
 {-2.88007,-1.79372,-1.81939,-6.33952,-5.42191},{-2.94096,-1.8705,-1.04659,0,-5.9382},
 {-3.00545,-2.5603,-1.14478,-12.637,-5.87252},{-3.12462,-2.05841,-1.2814,-6.63924,-4.56169},
 {-3.15717,-1.87809,-2.13397,-6.53378,-9.22608},{-5.96966,-1.56194,-10.0711,-6.48629,-7.5176},
 {-2.8825,-1.60735,-1.30394,-6.72428,-5.83372},{-2.54989,-1.65592,-1.29924,-7.26422,-5.02008},
 {-2.55175,-1.92627,4.36713,-8.24918,-3.24031},{-2.68259,-2.46921,-1.35072,-5.1584,-5.81326},
 {-2.7642,-2.04738,-1.49208,-5.78859,-5.51309},{-2.83568,-2.13715,-0.966458,-6.29401,-5.50667},
 {-3.25703,-2.21809,-1.0429,-6.48135,-4.83744},{-3.41949,-2.23744,-1.41273,-6.48503,-5.86511},
 {-2.81817,-1.62158,-1.31235,-6.42587,-7.46793},{-2.55747,-1.66047,-2.3501,-7.22216,-4.75924},{-2.7658,-1.52766,4.42157,-5.87914,-4.5517},
 {-2.68263,-1.85017,-1.45391,-4.80219,-6.08356},{-2.96828,-2.01866,-1.25234,-5.48023,-4.93588},
 {-3.08165,-2.10359,-0.963033,-6.26121,-6.0361},{-3.24358,-2.14413,-1.10553,-6.2898,-5.69808},
 {-3.46909,-2.26438,-1.01026,-6.484,-5.94237}}

