6
$\begingroup$

I need to use the discrete Fourier transform for function that represented as list of values.

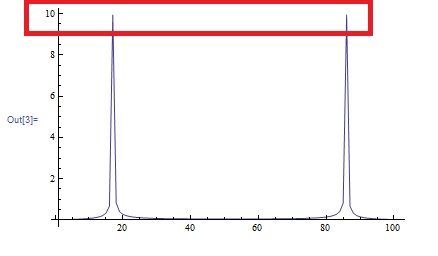
I started with an easy task to check my understanding. I tried to get the amplitude values for 2*Sin[x]. I think they should be somwhere about 2. But using the discrete Fourier operation produces something quite different. Can someone tell me where my mistakes are?

Here is what I tried.

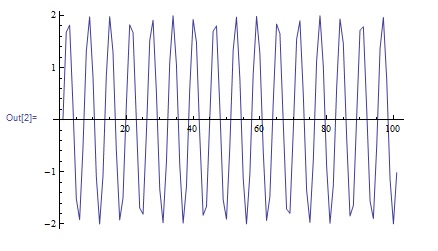
data = Table[2*Sin[x], {x, 0, 100}];
ListPlot[data, Joined -> True]

enter image description here

ListPlot[Abs[Fourier[data]], Joined -> True, PlotRange -> All]

enter image description here

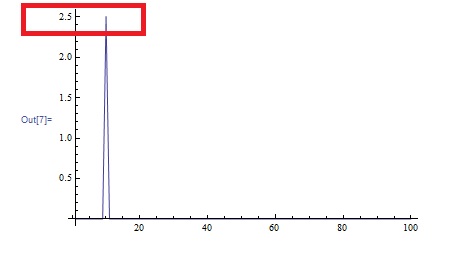
ListPlot[
  Table[Abs[FourierTransform[2*Sin[x], x, w]] /. 
    DiracDelta -> DiscreteDelta, {w, 0.1, 10, 0.1}], 
  Joined -> True, 
  PlotRange -> All]

enter image description here

How can I get the same results from 'Fourier' as I get from 'FourierTransform'?

$\endgroup$
4
  • $\begingroup$ related $\endgroup$
    – Sektor
    Commented Mar 15, 2014 at 12:07
  • 2
    $\begingroup$ Have you looked at the definition of Fourier and FourierTransform in the documentation? It is given in the first bullet point under Details and Options for both functions. $\endgroup$ Commented Mar 15, 2014 at 12:14
  • $\begingroup$ I understand that there is a difference in the way of having the result. The question is - how to reach the same results for this two operations. $\endgroup$
    – user12991
    Commented Mar 15, 2014 at 12:37
  • $\begingroup$ @user12991 I answered your question below by showing how to get direct correspondence between Fourier and FourierTransform $\endgroup$ Commented Oct 3, 2018 at 14:50

2 Answers 2

12
$\begingroup$

Paying close attention to the documentation for Fourier and FourierTransform one notes that the coefficients of the Sum/Integral terms are different; therefore, to obtain a discrete transform with amplitudes equal to those from the continuous transform, one must multiply the former by Sqrt[2 Pi / n] where n is the length of the dataset:

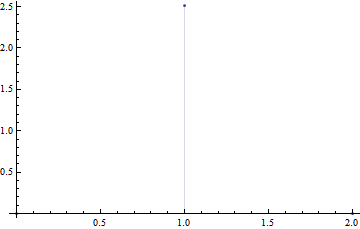
The continuous waveform:

DiscretePlot[
 Evaluate[Abs@FourierTransform[2 Sin[x], x, w] /. 
   DiracDelta -> DiscreteDelta], {w, 0, 2}]

Mathematica graphics

and the discrete waveform:

With[{datalength = 100}, 
 ListPlot[(Sqrt[2 Pi]/Sqrt[datalength]) Abs[
    Fourier[Table[2*Sin[x], {x, 0, datalength}]]], Joined -> True, 
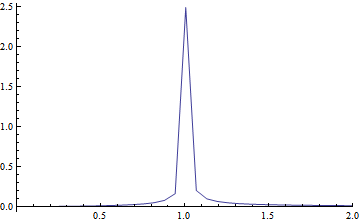
  PlotRange -> {{0, 2}, All}, DataRange -> {0, 2Pi}]]

Mathematica graphics

Appendix: Why isn't the amplitude "right"

In the comments, the OP asks why the amplitude of the function 2 Sin[x] appears to be ~2.5 in the transformed data. Let's take a pedagogical approach here, in part to show off how one might use Mathematica to answer these types of questions on their own.

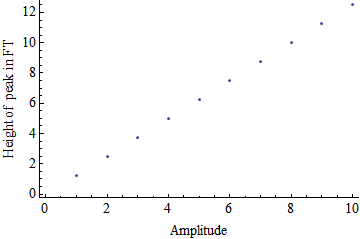
Is there a relationship between the amplitude of the wave and the height of the peak in the transform?

Hopefully, the answer is yes, but let's generate some data, plot it and see.

testdata = 
 Table[{i, 
   Evaluate[
    Abs@FourierTransform[i Sin[x], x, w] /. {DiracDelta -> 
       DiscreteDelta, w -> 1}]}, {i, 1, 10, 1}]

Mathematica graphics

There is a linear relationship - yeah! What is that relationship?

Let's perform a linear least squares analysis on testdata to see what the slope of that line is. I will assume that the plot should go through zero.

LinearModelFit[testdata, x, x]["BestFitParameters"] // Chop
(* {0, 1.25331} *)

So that means that the height of the peak in the transformed data will be 1.25331 times larger than the amplitude of the time-domain function. Where does this 1.25331 come from? Taking a closer look at testdata:

Mathematica graphics

We see a Sqrt[2 Pi]/2 nestled in there. Evaluating N@Sqrt[2 Pi]/2 yields:

(* 1.25331 *)

Nice.

$\endgroup$
5
  • $\begingroup$ Oh) So fast answer. But I feels like I am absolutely dummy. In the doc. about functions I see that it is deffers in the coefficiens. But I have no idea for now how was the Sqrt[2 Pi / n] value was reashed? Will it be the same for any function? Or it is different all the time? Looks like in definition the coefficient at the integral/summ is differs all the time on 1/sqrt[2], is it wrom somwhere here? $\endgroup$
    – user12991
    Commented Mar 15, 2014 at 13:12
  • $\begingroup$ @user12991 The 1/Sqrt[n] is in the Fourier equation and the 1/Sqrt[2 Pi] is in the FourierTransform equation. To convert from one to the other you need to multiply by one coefficient and divide by the other, hence the Sqrt[2 Pi/n]. This value should remain the same for all functions you are trying to transform. $\endgroup$ Commented Mar 15, 2014 at 13:51
  • $\begingroup$ Oh thank you. And what about the accuracy of the solving? Looks like now the accurancy of the amplitude is somwhere about 25% o mistake (as the real 2*Sin[x] amplitude is 2). How to increase the accuransy? $\endgroup$
    – user12991
    Commented Mar 15, 2014 at 14:01
  • $\begingroup$ Thank you so much for the evaluation the coefficient of the amplitude/peak height relations that I can use for my transformations of different functions (so as I understand valid for the using fot the different functions by using Fourier discrete transformations?). And even bigger thanks for such big and powerful explanations. That is even more I have ever imagine) $\endgroup$
    – user12991
    Commented Mar 15, 2014 at 16:14
  • $\begingroup$ @user12991 Glad I could help. If the problem is resolved, please consider accepting this answer. $\endgroup$ Commented Mar 15, 2014 at 16:46
1
$\begingroup$

This code will show a very tight correspondence between Fourier and FourierTransform. For the continuous case, note the imaginary negative infinite DiracDelta spike at w=-1 (2nd term of answer), and the positive one at w=1.

FourierTransform[2*Sin[x], x, w]
(*I*Sqrt[2*Pi]*DiracDelta[-1+w]-I*Sqrt[2*Pi]*DiracDelta[1+w]*)

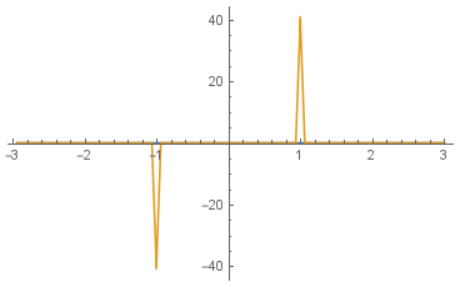
Here is the original table range in your question modified slightly to fit an exact number of wavelengths. 32Pi is slightly over 100, and Pi/3 is a little more than 1. The pure function and Thread are used to break the real and imaginary components into two separate lines for plotting purposes. This link shows the code snippet for dftMost, which uses Fourier.

ListPlot[Thread[{{#,Re@#2},{#,Im@#2}}&@@@
First[dftMost@Table[{x,2Sin[x]},{x,0,32Pi,Pi/3}]]],
Joined->True,PlotRange->All]
enter image description here

Note the negative and positive spikes in the imaginary component of the discrete Fourier transform at w=-1 and w=1. If you use more points in the Table command, the spikes will increase toward infinity.

DeleteCases[Chop@Cases[%,Line[pts_?MatrixQ]:>pts,
Infinity],{_,0},Infinity]
(*{{},{{-1.,-40.1061},{1.,40.1061}}}*)

Here we pull out the nonzero real and imaginary components from the blue (real) and orange imaginary components in the ListPlot graph above. There are no nonzero real compoents, so that first list is empty. The only two non-zero imaginary components are at w=-1 and w=1 in the 2nd list, as previously mentioned.

Bonus: You may also like to see a case where the continuous transform isn't integrated from negative to positive infinity, but is instead windowed. By changing the number of periods of integration, n, you can watch the aforementioned frequency peaks gradually rise toward infinity.

fourierTransform[f_,{t_,tini_,tfin_},w_,a_,b_]:=
Sqrt[Abs@b/(2Pi)^(1-a)] Integrate[f Exp[I b w t],{t,tini,tfin}]
Assuming[{n>=1,(n/2)\[Element]Integers},With[{T=n 2Pi/w0},
fourierTransform[2 Sin[w0 t],{t,-T/2,T/2},w,0,1]/.w0->1//Simplify]]
(*2*I*Sqrt[2/Pi]*Sin[n*Pi*w]/(-1+w^2)*)
Plot@@{Through@{Re,Im}@%/.n->16,{w,-2,2},PlotRange->All} 
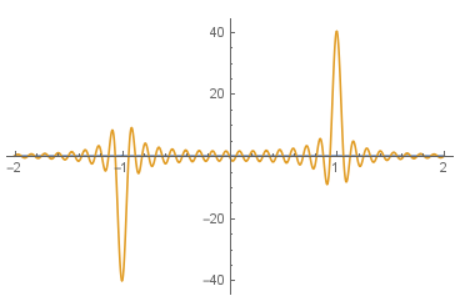
Limited periods for continuous transform

$\endgroup$

Your Answer

By clicking “Post Your Answer”, you agree to our terms of service and acknowledge you have read our privacy policy.

Not the answer you're looking for? Browse other questions tagged or ask your own question.