23
$\begingroup$

I'm not very experienced with Fourier Transforms, so there may be something inherently wrong with attempting to do this, but how can I make the discrete Fourier behave like the continuous FourierTransform?

What is the equivelent way of doing the following with Fourier?

Func[x_] := Sin[x];

LogLogPlot[
 Abs[FourierTransform[Func[t] UnitStep[t], t, \[Omega]]], {\[Omega], 
  1*^-1, 1*^5}, PlotRange -> All]

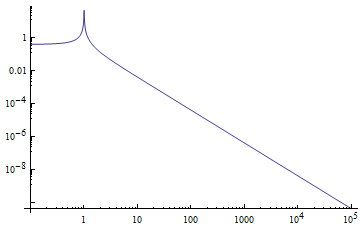
Fourier Transform of Sin(x)

My unsuccessful attempt at this is the following:

Func[x_] := Sin[x];

ListLogLogPlot[
 Abs[Fourier[Table[ Func[t] UnitStep[t], {t, 1*^-1, 1*^5} ]]], 
 PlotRange -> All]

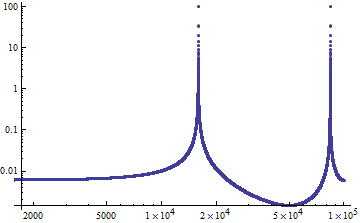
enter image description here

$\endgroup$
4
  • $\begingroup$ What is the function you would like to take the Fourier transform of, Sin[x] or Sin[x] UnitStep[x] ? $\endgroup$ Commented Jun 19, 2012 at 6:15
  • $\begingroup$ Sin[x], I think. Although, if I do a FourierTransform without UnitStep my graph is blank and/or constant. $\endgroup$ Commented Jun 19, 2012 at 6:21
  • $\begingroup$ You've looked into FourierParameters? $\endgroup$ Commented Jun 19, 2012 at 7:08
  • $\begingroup$ For others that may need a more robust match between Fourier and FourierTransform, I offer the following: mathematica.stackexchange.com/questions/181849/… $\endgroup$ Commented Sep 17, 2018 at 14:09

3 Answers 3

17
$\begingroup$

I think perhaps you need codes like this:

Func[x_] := Sin[x];
tmin = 0; tmax = 10; \[CapitalDelta]t = (tmax - tmin)/100;
tgrid = Table[t, {t, tmin, tmax, \[CapitalDelta]t}];
wgrid = RotateRight[(2 \[Pi])/(tmax - tmin)*
    Range[-((Length@tgrid - 1)/2), (Length@tgrid - 1)/2], (
   Length@tgrid - 1)/2];
ListLogLogPlot[{wgrid, 
   (tmax - tmin)/Sqrt[2 \[Pi]*Length@tgrid]*Abs[Fourier[
     Table[Func[t] UnitStep[t], {t, tmin, 
       tmax, \[CapitalDelta]t}]]]} // Transpose, Joined -> True,Mesh->All]

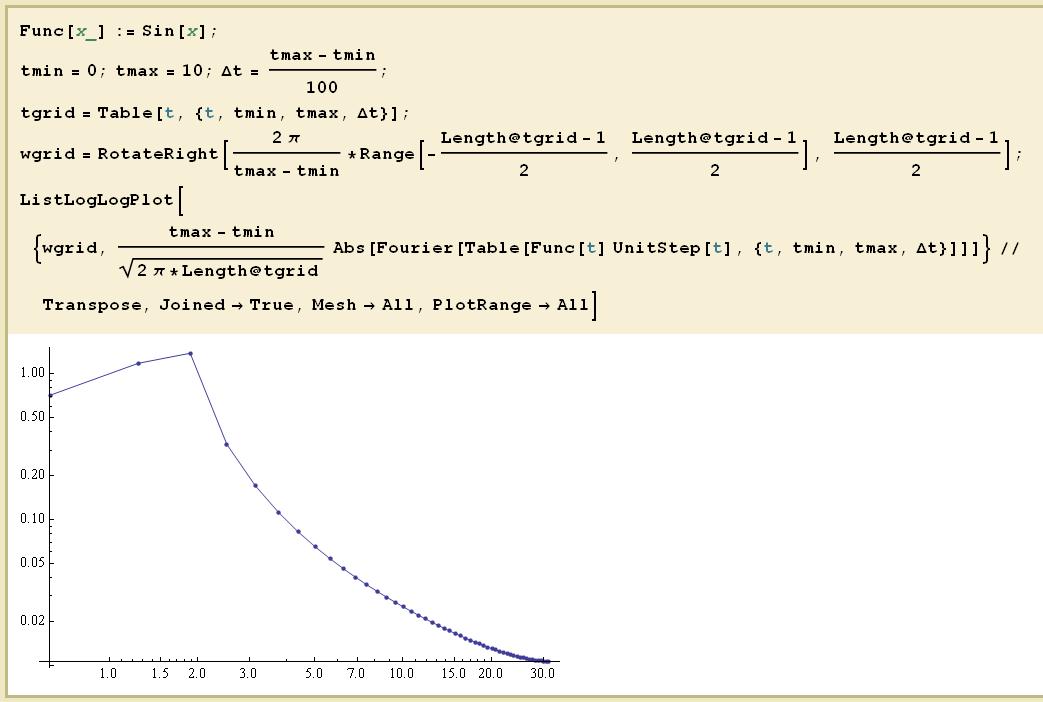
enter image description here

Edit:

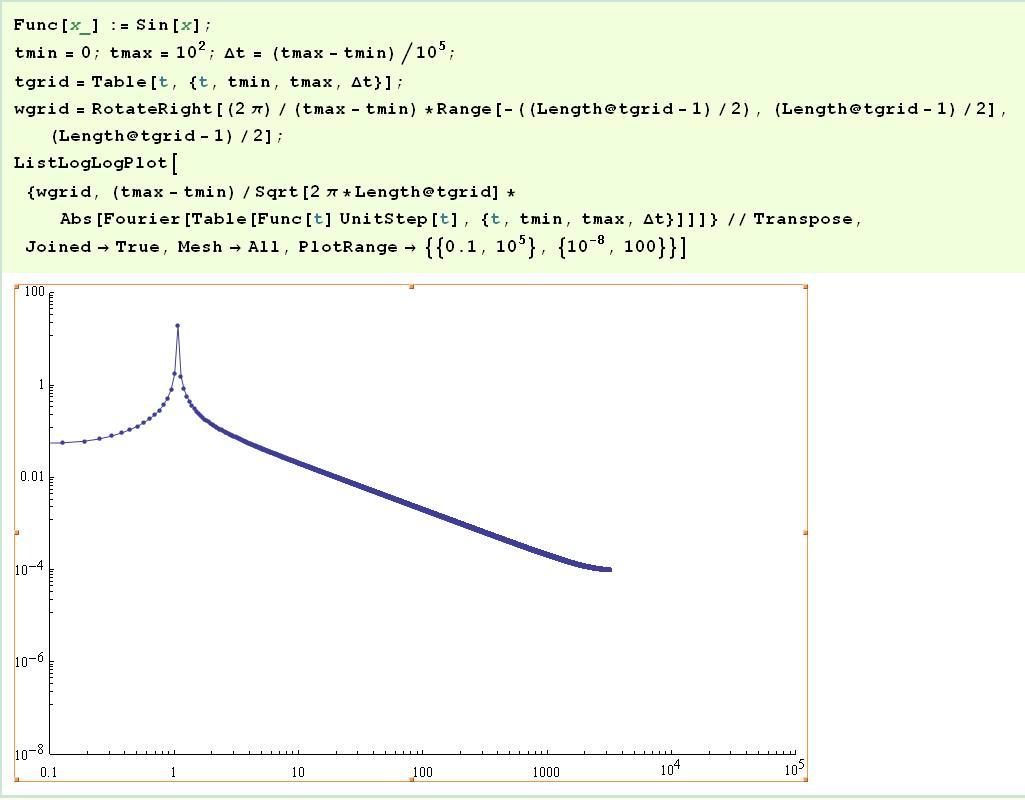
I update my codes in reply to image_doctor:

Func[x_] := Sin[x];
tmin = 0; tmax = 10^2; \[CapitalDelta]t = (tmax - tmin)/10^5;
tgrid = Table[t, {t, tmin, tmax, \[CapitalDelta]t}];
wgrid = RotateRight[(2 \[Pi])/(tmax - tmin)*
    Range[-((Length@tgrid - 1)/2), (Length@tgrid - 1)/
      2], (Length@tgrid - 1)/2];
ListLogLogPlot[{wgrid, (tmax - tmin)/Sqrt[2 \[Pi]*Length@tgrid]*
    Abs[Fourier[
      Table[Func[t] UnitStep[t], {t, tmin, 
        tmax, \[CapitalDelta]t}]]]} // Transpose, Joined -> True, 
 Mesh -> All, PlotRange -> {{0.1, 10^5}, {10^-8, 100}}]

enter image description here

$\endgroup$
7
  • $\begingroup$ @yulinyulin I'm interested, can you explain a little about how your code solves the problem? $\endgroup$ Commented Jun 20, 2012 at 8:24
  • $\begingroup$ @image_doctor, what problem? You mean the DiracDelta function? $\endgroup$
    – yulinlinyu
    Commented Jun 20, 2012 at 8:54
  • $\begingroup$ @yulinyulin sorry, I wasn't very specific. I meant the OPs original question. The graph you've plotted doesn't seem quite to resemble either of the OPs graphs. So I was interested in what approach you had taken in your solution and how it matched the original question. $\endgroup$ Commented Jun 20, 2012 at 9:01
  • $\begingroup$ @image_doctor, I've updated my codes, I hope this will satisfy you. $\endgroup$
    – yulinlinyu
    Commented Jun 20, 2012 at 9:16
  • $\begingroup$ Thanks, the similarity is much clearer. I'm still interested in the method you used. Did you take the Fourier points and then rescale the x coordinate in some way? $\endgroup$ Commented Jun 20, 2012 at 9:51
26
$\begingroup$

I think there are at least three elements to consider here:

  1. FourierTransform and Fourier, by default, output results in different forms
  2. Plotting Sin[x] UnitStep[x] is not the same as Sin[x] and behaves differently when used in conjunction with Fourier and FourierTransform
  3. Plot does not handle DiracDelta elegantly

The signal processing form of the Fourier transform of a continuous sine wave is a single Dirac delta function located at the frequency of the sine wave.

ListLinePlot[Abs[Fourier[Table[Sin[2 \[Pi] 1 t] , {t, 0, 5, 0.001}]]],
  PlotRange -> {Automatic, {0, 40}}]
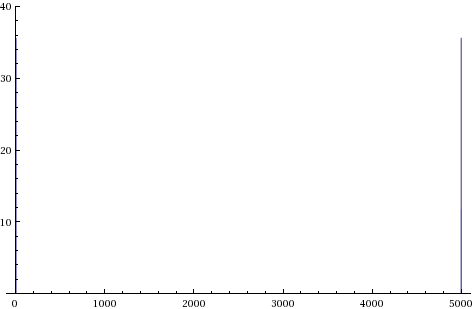
Mathematica graphics

Note the symmetric spikes around list element 2500 in the above plot of a sine wave with frequency of unity.

Fourier produces a result which runs up from 0 to max freq and then down from max freq to 0, consisting of two identical spectra reflected around the centre of the list. In contrast, by default FourierTransform produces an expression which covers the range 0 up to max freq.

If you reduce the resolution of the time steps:

ListLinePlot[Abs[Fourier[Table[Sin[2 \[Pi] 1 t] , {t, 0, 5, 0.1}]]], 
 PlotRange -> {Automatic, {0, 40}}]
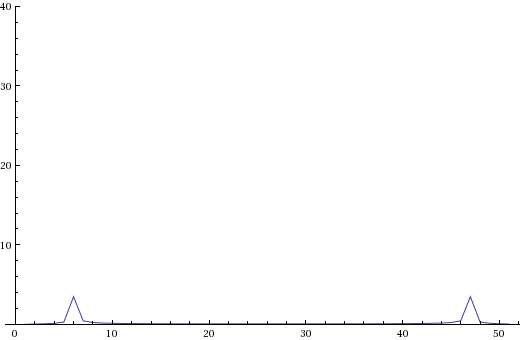
Mathematica graphics

the Dirac delta appears smeared out across a range of frequencies, this is an effect of the discrete nature of this transform.

I suspect there is an issue in the continuous case when using FourierTransform in that DiracDelta does not resolve to a numeric value when plotting, so you don't see the spike in the continuous form of the plot.

The result you obtain with when using Sin[x] UnitStep[x] in the discrete case is equivalent to Sin[x] as UnitStep[n] evaluates to 1, so use of the UnitStep results in no modification to the Sin function.

In the continuous case, Sin[x] UnitStep[x] does not evaluate to Sin[x] but a truncated sine wave. Sharp discontinuities, such as those introduced by unit steps, cause a smearing in the frequency domain. I suspect this is the origin of your broad spectrum like plot for the continuous case as can be seen by examining the Fourier transforms of the two expressions.

FourierTransform[Sin[t], t, \[Omega]]

$$i \sqrt{\frac{\pi }{2}} \text{DiracDelta}[-1+\omega ]-i \sqrt{\frac{\pi }{2}} \text{DiracDelta}[1+\omega ]$$

FourierTransform[Sin[t] UnitStep[t], t, \[Omega]]

$$-\frac{1}{2 \sqrt{2 \pi } (-1+\omega )}+\frac{1}{2 \sqrt{2 \pi } (1+\omega )}+\frac{1}{2} i \sqrt{\frac{\pi }{2}} \text{DiracDelta}[-1+\omega ]-\frac{1}{2} i \sqrt{\frac{\pi }{2}} \text{DiracDelta}[1+\omega ]$$

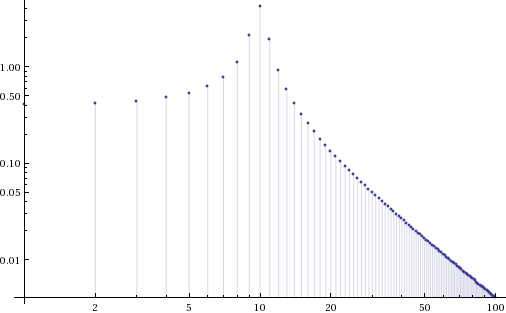
Which has terms inversely proportional to omega giving the long tail in your FourierTransform plot.

One option might be to replace DiracDelta with its discrete counterpart DiscreteDelta which evaluates to 1 at its location.

Table[DiscreteDelta[n], {n, -2, 2}]

{0, 0, 1, 0, 0}

FourierTransform[Sin[t], t, \[Omega]] /. DiracDelta -> DiscreteDelta

$$i \sqrt{\frac{\pi }{2}} \text{DiscreteDelta}[-1+\omega ]-i \sqrt{\frac{\pi }{2}} \text{DiscreteDelta}[1+\omega ]$$

Sin[x] using FourierTransform

ListLogLogPlot[
 Table[Abs[FourierTransform[Sin[t]  , t, \[Omega]]] /. 
   DiracDelta -> DiscreteDelta, {\[Omega], 0.1, 10, 0.1}], 
 PlotRange -> All, Filling -> Axis]
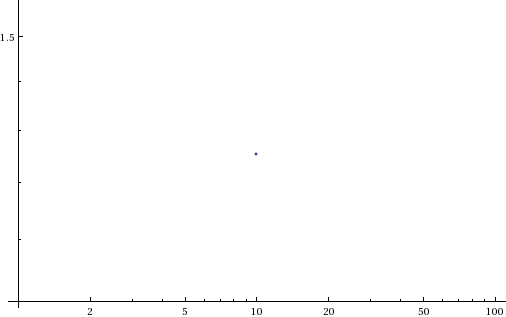
Mathematica graphics

Sin[x] UnitStep[x] using FourierTransform

ListLogLogPlot[
 Table[Abs[FourierTransform[Sin[t] UnitStep[t] , t, \[Omega]]] /. 
   DiracDelta -> DiscreteDelta, {\[Omega], 0.1, 10, 0.1}], 
 PlotRange -> All, Filling -> Axis]
Mathematica graphics

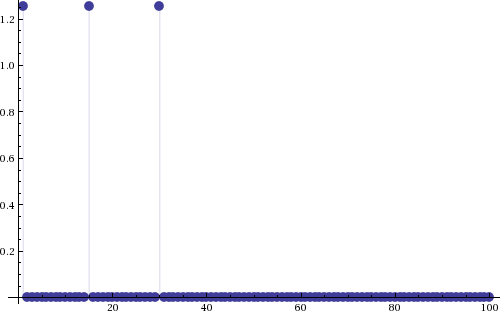
Multiple Frequencies

ListPlot[Table[
  Abs[FourierTransform[Sin[t] + Sin[15 t] + Cos[30 t], 
     t, \[Omega]] /. {DiracDelta -> DiscreteDelta, \[Omega] -> 
      f}], {f, 1, 100, 1}], Filling -> Axis, 
 PlotStyle -> PointSize[0.02]]
Mathematica graphics

$\endgroup$
6
  • $\begingroup$ Very helpful explanation. +1 I went with yulinlinyu's answer as it does a good job of matching that initial image, but really I'm now interested in knowing how to make the continuous fourier transform behave like the images in your post. Perhaps I'll be able to figure that out will all of this info! $\endgroup$ Commented Jun 21, 2012 at 3:10
  • $\begingroup$ @EmpireJones No problem :), May I ask again what your goal is? Do you want a plot of Sin[x] or Sin[x] UnitStep[x], these are not the same thing. $\endgroup$ Commented Jun 21, 2012 at 6:34
  • $\begingroup$ @EmpireJones The Fourier transform of Sin[x] is a single Dirac delta function, not a wideband spectrum as Sin[x] UnitStep[x] is. $\endgroup$ Commented Jun 21, 2012 at 6:50
  • $\begingroup$ Plot of Sin[x]. When I try using the plotting method that you used above for Sin[15 x] + Sin[x] + Cos[x 30], I get only two visible points, instead of the 6 peaks that the discrete version comes up with. Perhaps the plot functionality can't pick up on the narrow point. It's also interesting that the Filling doesn't show up in your second to last image. $\endgroup$ Commented Jun 22, 2012 at 3:56
  • $\begingroup$ The discrete Fourier transform produces a spectrum {Fmax->0,0->Fmax} whilst the symbolic version gives {0->Fmax}, hence half the number of points. $\endgroup$ Commented Jun 22, 2012 at 7:33
3
$\begingroup$

The answers given so far have already solved the issue, but I think the following piece of code, based on @yulinlinyu's answer may be helpful to people:

Options[fourierData] = {FourierParameters -> {0, 1}};

fourierData[data_?MatrixQ, OptionsPattern[]] := 
Module[{xGrid, pGrid, f, x0, x1, NN, DFT},
  {xGrid, f} = Transpose[data];

  {x0, x1} = MinMax[xGrid];
  NN = Length[xGrid] - 1;

  pGrid = RotateRight[
    Range[-NN/2, NN/2] 2.0 \[Pi] / (x1 - x0), 
    Quotient[NN, 2]
  ];

  DFT = Fourier[f, FourierParameters -> OptionValue[FourierParameters]]
    (x1 - x0) / Sqrt[2 \[Pi] (NN)];

  Transpose@{pGrid, Abs@DFT}
]

It takes a matrix of the form {{x1, f[x1]}, {x2, f[x2]}, ...} and returns the Fourier transformed matrix {{p1, F[p1]}, {p2, F[p2]}, ...}, where F is the Fourier transform of f.

For example,

Show[{
  ListLinePlot[
    fourierData[
      Table[{x, Sinc[x]}, {x, -100, 100, 1}]
    ],
    PlotStyle -> ColorData[112, 2],
    PlotTheme -> "Scientific"
  ],
  With[{CFT = FourierTransform[Sinc[x], x, p]},
    Plot[CFT, {p, -6, 6}, PlotStyle -> ColorData[112, 1]]
  ]
}]

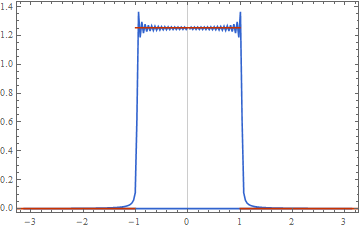
gives

Fourier vs FourierTransform

Note, that the grid must be equidistant for fourierData to work. One could extend this to non-uniform grids using an interpolation.

$\endgroup$

Your Answer

By clicking “Post Your Answer”, you agree to our terms of service and acknowledge you have read our privacy policy.

Not the answer you're looking for? Browse other questions tagged or ask your own question.