2
$\begingroup$

Sorry for my bad english. I need to plot periodic function from dirac delta: δT(t)=∑δ(t–n*T), where T - is a constant, and n=-20..20 And after them, plot new function fd=f(t)*δT(t) - discrete signal of signal f(t)

I tried to solve it:

betta[t_] := Piecewise[{{1, t == 0}}]
bettaT[t_] := Sum[betta[t - n*T], {n, -20, 20}]
Plot[bettaT[t], {t, -10, 10}]

but graphic is always on 0 level. I suspect that it is precision of the comparison t==0, but a don't know how to solve it right

$\endgroup$
3
  • $\begingroup$ Related: 42393, 39445 $\endgroup$
    – Michael E2
    Commented Feb 23, 2014 at 15:20
  • $\begingroup$ What you are describing as your new discrete function is essentially a sampling of the function f[t] at specific (integer-valued) time points. Is this what you are trying to accomplish, or do you really need to do the plots? $\endgroup$
    – bill s
    Commented Feb 23, 2014 at 15:57
  • $\begingroup$ yes, i have continuous function f(t)=cos^(Pi/2 * t) and i should sampling it. For this I create periodic function bettaT and multiply it to my f(t). And I should get fd(t)=f(t) if bettaT(t)=1, else null $\endgroup$
    – Venzo
    Commented Feb 23, 2014 at 16:04

1 Answer 1

0
$\begingroup$

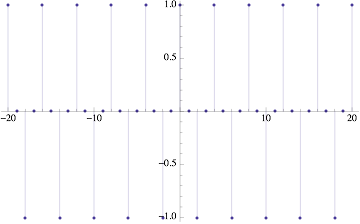
You can accomplish the sampling of your function much more easily than the route you describe. The following defines the function in the first line, and then samples it at all integer locations (in the Table) and then plots using ListPlot.

f[t_] := Cos[t Pi/2];
ListPlot[Table[{t, f[t]}, {t, -20, 20}], Filling -> Axis]

enter image description here

$\endgroup$
4
  • $\begingroup$ Thanks, it's really cool, but I should sample my function through Dirac delta. It's my task in university( $\endgroup$
    – Venzo
    Commented Feb 23, 2014 at 17:53
  • $\begingroup$ I'm not sure I follow what you are trying to do -- the answer will be identical to what is plotted above. The Direcdelta is a mathematical formalism representing the sampling of functions, it is not a recipe for computer implementation. $\endgroup$
    – bill s
    Commented Feb 23, 2014 at 17:58
  • $\begingroup$ I will try to explain entire task. I have signal f(t)=cos^2(Pi/2*t). Through fourier transform i retrieve F(f) and A(f) - frequency response and calculate fmax. After that, through inverse fourier transform i retreive f1(t)~f(t). Now a have T=0.28 and periodic function δT(t)=∑δ(t – n*T), where sum from n=-20 to n=20. I know, that δ(t)=1 if t = 0 and 0 if t<>0. After I was able to plot periodic function, I should retreive new function fd(t)=f1(t)*δT(t) - sampling of function f1(t) and plot it. $\endgroup$
    – Venzo
    Commented Feb 23, 2014 at 18:16
  • $\begingroup$ Maybe you should try to explain clearly what you are trying to do. You can edit the question to include all the relevant information. $\endgroup$
    – bill s
    Commented Feb 23, 2014 at 19:47

Not the answer you're looking for? Browse other questions tagged or ask your own question.