4
$\begingroup$

I'm trying to plot the Fourier transform of $\sin (2 t)$.

I tried using the FourierTransform Function (I'm expecting a peak at w = 2) but it gives me undefined at w = 2 because the DiracDelta function is not defined at DiracDelta[0]. Is there any way around this? I used

Plot[FourierTransform[Sin[2*t], t, w], {w, -3, 3}, PlotRange -> Full]
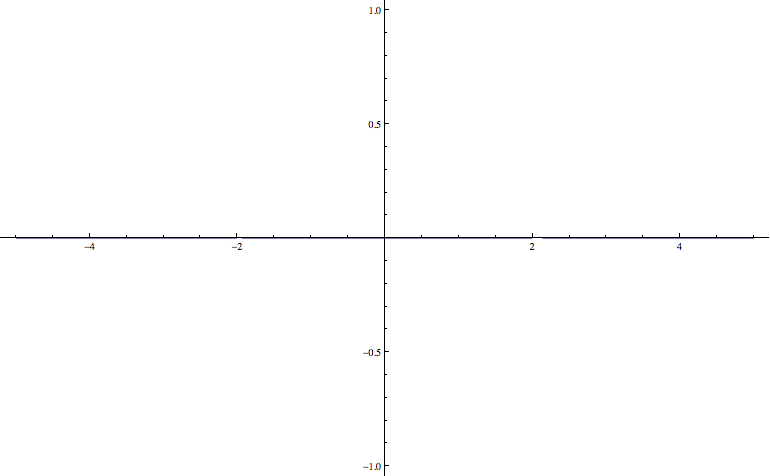
enter image description here

which has gaps at 2 and -2, but no height. How do I get a peak with some height there?

$\endgroup$
1

1 Answer 1

2
$\begingroup$

Since the transform has complex delta functions, you have to create a representation by hand.

FourierTransform[Sin[2*t], t, w]
(*
  I Sqrt[\[Pi]/2] DiracDelta[-2 + w] - I Sqrt[\[Pi]/2] DiracDelta[2 + w]
*)

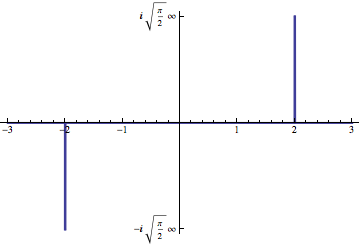
Here's one way that includes marking the axes by hand.

Plot[UnitBox[100 (2 - w)] - UnitBox[100 (2 + w)],
 {w, -3, 3}, Exclusions -> {-2, 2}, PlotStyle -> Thick,
 Ticks -> {Automatic, {{-1, Row[{-I Sqrt[Pi/2], Infinity}]}, {1, 
     Row[{I Sqrt[Pi/2], Infinity}]}}}]

Mathematica graphics

$\endgroup$

Your Answer

By clicking “Post Your Answer”, you agree to our terms of service and acknowledge you have read our privacy policy.

Not the answer you're looking for? Browse other questions tagged or ask your own question.