I want to produce graphs of Fourier transforms for lectures.
Using the answer from Calling Correct Function for Plotting DiracDelta I get a problem with the code mentioned below.
Definition of Mr. Fortuño
    ArrowsDeltaFunction[eqn_, x_] :=
  Module[{xsubs, listDeltas, coefDeltas, locationDeltas},
   xsubs = (x /.
       Cases[eqn, DiracDelta[a__] :> Solve[a == 0, x], Infinity]) /.
     x -> {};
   listDeltas = DiracDelta[x - x0] /. x0 -> xsubs;
   coefDeltas = Flatten[Coefficient[eqn, listDeltas]];
   locationDeltas = Flatten[xsubs];
   ar = Arrow[
     Table[{{locationDeltas[[i]], 0}, {locationDeltas[[i]],
        coefDeltas[[i]]}}, {i, 1, Length[locationDeltas]}]];
   ds = Table[{EdgeForm[Opacity[0.8]], White,
      Disk[{locationDeltas[[i]], 0}, 0.15]}, {i, 1,
      Length[locationDeltas]}];
   ards =
    Table[{Arrowheads[Medium],
      Arrow[{{locationDeltas[[i]], 0}, {locationDeltas[[i]],
         coefDeltas[[i]]}}], {EdgeForm[Opacity[0.8]],
       White, {AspectRatio -> Automatic,
        Disk[{locationDeltas[[i]], 0}, 0.05]}}}, {i, 1,
      Length[locationDeltas]}]
   ];
and his example (modified with parameter lambda)
    Ft := (1 - I/2) Exp[-I t] + Cos[\[Lambda]1 t] +
  2 Sin[\[Lambda]2 (t - 2)]

(*Fourier Transform*)
Fw := FourierTransform[Ft, t, w]
Fw
ReFw := ComplexExpand[Re[Fw]]
ImFw := ComplexExpand[Im[Fw]]

\[Lambda]1 = 3; \[Lambda]2 = 2;

Fw
ReFw := ComplexExpand[Re[Fw]]
ImFw := ComplexExpand[Im[Fw]]

(*Plot*)
Plot[{ReFw, ImFw}, {w, -5, 5}, PlotStyle -> {Thick, Red, Blue},
 PlotRange -> 3, AxesLabel -> {"w", "F(w)"},
 PlotLegends -> LineLegend[{Red, Blue}, {"Real part", "Imag part"}],
 Epilog -> {Thick, Red, ArrowsDeltaFunction[ReFw, w], Blue,
   ArrowsDeltaFunction[ImFw, w]}]
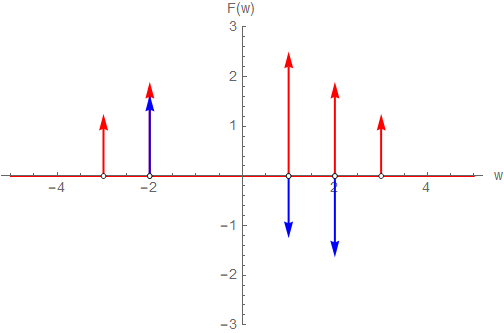
I get the correct picture
Using
Ft := A1 Sin[\[Omega]1 t + \[Phi]1] + A2 Sin[\[Omega]2 t + \[Phi]2];
with
A1 = 1; A2 = 1.25; \[Omega]1 = 4.6; \[Omega]2 = 4.3; \[Phi]1 = 0; \[Phi]2 = \[Pi]/2;
gives
    1.56664 DiracDelta[(4.3 + 0. I) - \[Omega]] +
 I Sqrt[\[Pi]/2] DiracDelta[(4.6 + 0. I) - \[Omega]] +
 1.56664 DiracDelta[(4.3 + 0. I) + \[Omega]] -
 I Sqrt[\[Pi]/2] DiracDelta[(4.6 + 0. I) + \[Omega]]
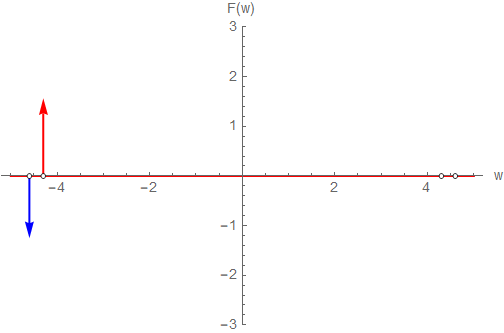
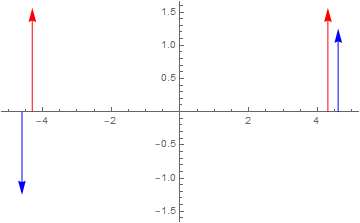
and the picture is missing two arrows
Why is Mathematica substituting complex values with zero imaginary parts?
Why are the missing to arrows not plotted (the circles are there)?
Any help is appreciated
Please notice
Adding a comment to Francisco Rodríguez Fortuño and Ponkadoodles original answer was not possible, therefore I created this new question.
I have also visited the following links which did not solve my problem.
Is marked as having solutions Plot periodic function from Dirac delta function and links to the following two links that only offer manual solutions Plot Fourier transform of $\sin (2 t)$ Plot Dirac Delta function


1.566. $\endgroup$