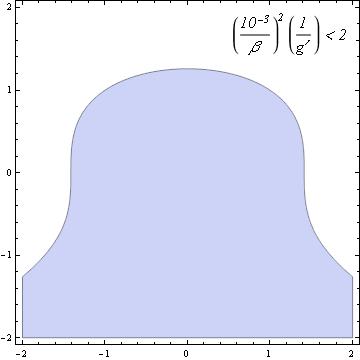
I am trying to label a plot with an equation. The problem is that Mathematica formats things almost well but not exactly. The parenthesis are of the wrong size, and the powers are not high enough.
For example:
testplot = RegionPlot[x^2 + y^3 < 2, {x, -2, 2}, {y, -2, 2}];
Overlay[{testplot,
        Text[(10^-3/\[Beta])^2  (("1")/g') < 2, BaseStyle -> {FontSize -> 18}]},
        Alignment -> {0.9, 0.85}
       ]
I need the equation to look like it would on Latex, but here is what I get instead:
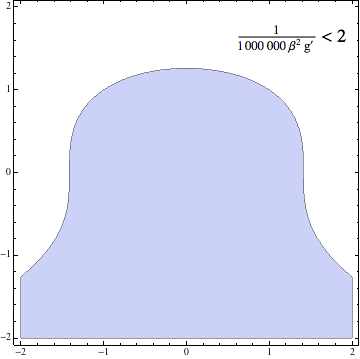
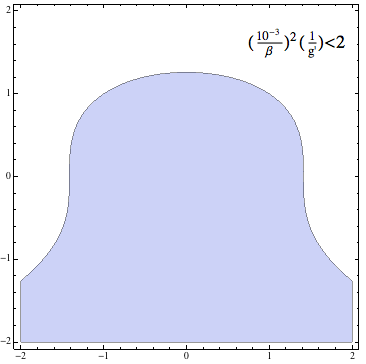
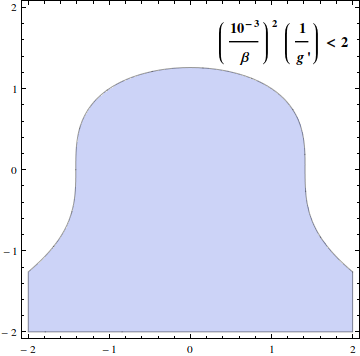
I tried putting the equation between "" but the parenthesis would be the wrong size and the powers are off. Just like this:
Any suggestions? Thanks! L.


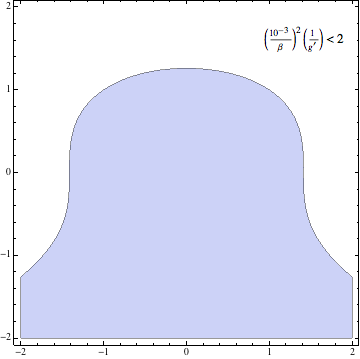

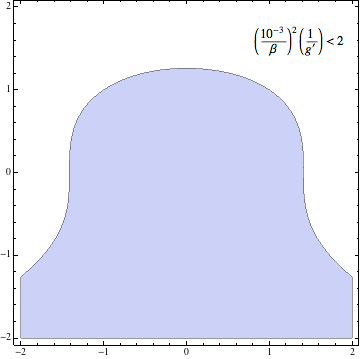
 You can play with the FontSize and occasionally with the FonSlant (needed, or not). You can possibly add FontFace->Bold, if desired.
"", then go between the quotes, press Ctrl-9 and type the equation using "2D notation". 2. use TraditionalForm and HoldForm. The second one gives better spacing around<. dropbox.com/s/44g6prc26sy7xsf/… $\endgroup$