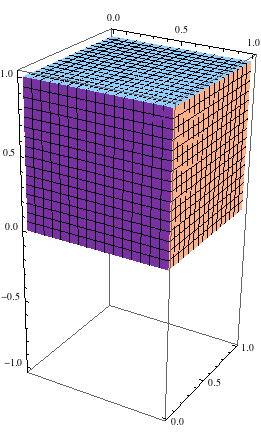
This will be easy to break as there's a bunch of things it doesn't check for but when I wrote it I was not after good code but rather a quick solution. It should definitely get you started. It plots a ParametricPlot3D for ever two variables using the endpoints of the third (assuming it a parameter) and you can specify whether to include all of them or not.
ClearAll[myParametricPlot3D]
Options[myParametricPlot3D] = {Exclude -> {}};

myParametricPlot3D[vField_,
  param1Range_?VectorQ /; Length[param1Range] === 3,
  param2Range_?VectorQ /; Length[param2Range] === 3,
  param3Range_?VectorQ /; Length[param3Range] === 3,
  opts : OptionsPattern[{ParametricPlot3D, myParametricPlot3D}]] :=
 Module[{p1, p2, p3, goodOpts, newOpts},
  goodOpts = FilterRules[{opts}, Options[ParametricPlot3D]];
  newOpts = FilterRules[{opts}, Options[myParametricPlot3D]];
  p1 = If[! (OptionValue[Exclude]~Intersection~{3} === {}),
    {},
    Block[{a, b, c, p11, p12},
     {a, b, c} = Evaluate@param3Range;
     p11 =
      ParametricPlot3D[Evaluate@vField /. a -> b,
       Evaluate@param1Range, Evaluate@param2Range, Evaluate[goodOpts]];
     p12 =
      ParametricPlot3D[Evaluate@vField /. a -> c,
       Evaluate@param1Range, Evaluate@param2Range, Evaluate[goodOpts]];
     Show[p11, p12]
     ]];
  p2 = If[! (OptionValue[Exclude]~Intersection~{1} === {}),
    {},
    Block[{a, b, c, p11, p12},
     {a, b, c} = Evaluate@param1Range;
     p11 =
      ParametricPlot3D[Evaluate@vField /. a -> b,
       Evaluate@param2Range, Evaluate@param3Range, Evaluate[goodOpts]];
     p12 =
      ParametricPlot3D[Evaluate@vField /. a -> c,
       Evaluate@param2Range, Evaluate@param3Range, Evaluate[goodOpts]];
     Show[p11, p12]
     ]];
  p3 = If[! (OptionValue[Exclude]~Intersection~{2} === {}),
    {},
    Block[{a, b, c, p11, p12},
     {a, b, c} = Evaluate@param2Range;
     p11 =
      ParametricPlot3D[Evaluate@vField /. a -> b,
       Evaluate@param3Range, Evaluate@param1Range, Evaluate[goodOpts]];
     p12 =
      ParametricPlot3D[Evaluate@vField /. a -> c,
       Evaluate@param3Range, Evaluate@param1Range, Evaluate[goodOpts]];
     Show[p11, p12]
     ]
    ];
  If[p1 === {} && p2 === {} && p3 === {},
   $Failed,
   Show[{p1, p2, p3}]
   ]
  ]
You can use it (in your example):
myParametricPlot3D[{x, y, z}, {x, 0, 1}, {y, 0, 1}, {z, 0, 1}]

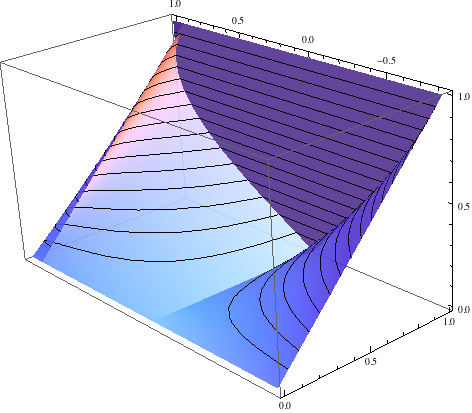
And there's an option to exclude a plot with a particular parametric dependence. So the following, doesn't plot the parametric dependence from z at 0, 1:
myParametricPlot3D[{x, Sin[y z], x z}, {x, 0, 1}, {y, -1, 2}, {z, 0,
  1}, PlotRange -> All, MeshFunctions -> {#3 &},
 PlotStyle -> Opacity[0.9], Exclude -> {3}]

USE "HEAVY" OPTIONS LIKE PlotPoints WITH CAUTION! (you are applying them to six different plots)


RegionPlot3Dhere, with a little bit different syntax, but I'm not sure what is your goal in general. $\endgroup$